Postgres gives you three levels of information about a query. They are concentric: each one adds to the previous without replacing it. Most developers learn the first level, use it for everything, and never turn on the other two. That is a mistake. EXPLAIN tells you what Postgres plans to do. EXPLAIN ANALYZE tells you what happened when it actually ran. EXPLAIN ANALYZE BUFFERS tells you how much I/O the run cost. Each level answers a different kind of question, and the gap between them is where most performance bugs live. This post walks the three levels end to end, with real output, on a real schema.
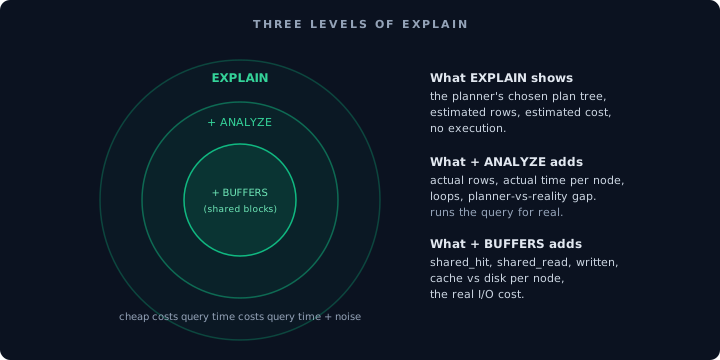
Each ring contains the previous one. BUFFERS does not replace ANALYZE. ANALYZE does not replace EXPLAIN.
Level 1: EXPLAIN, the cheap peek
Plain EXPLAIN does not execute the query. It asks the planner to choose a plan and prints the tree, along with the planner's row estimates and cost estimates. The cost is in an arbitrary unit calibrated to sequential-page I/O and is not directly comparable to milliseconds.
Use EXPLAIN when you want to know whether a query will hit an index, whether the join order is sane, or whether the planner is about to do something obviously wrong on a table you cannot execute against in production. It is fast, safe, and free of side effects.
EXPLAIN SELECT * FROM orders WHERE customer_id = 1234;

                          QUERY PLAN
-------------------------------------------------------------
 Index Scan using orders_customer_idx on orders
   Index Cond: (customer_id = 1234)
   (cost=0.43..12.52 rows=4 width=132)
Two things to read off this output. The plan node is an Index Scan, which means Postgres will use orders_customer_idx and should be fast. The estimate is four rows. If you expected four thousand rows, the statistics on this table are stale and someone needs to run ANALYZE. Bad estimates cause bad plans, especially for joins.
Level 2: EXPLAIN ANALYZE, the actual run
Adding ANALYZE runs the query for real and reports actual row counts and actual time per plan node, alongside the estimates. It is the right tool when a query is slow and you want to know why.
Two important consequences of running it: the query has side effects if it is a write, and it takes as long as the query takes. Wrap writes in a transaction and roll back. For slow queries, be patient.
EXPLAIN ANALYZE SELECT * FROM orders WHERE total > 500;

                          QUERY PLAN
----------------------------------------------------------------------
 Seq Scan on orders
   Filter: (total > 500)
   Rows Removed by Filter: 99,400
   (cost=0.00..2,451.00 rows=600 width=132)
   (actual time=0.012..18.450 rows=600 loops=1)
 Planning Time: 0.118 ms
 Execution Time: 18.502 ms
This is a Seq Scan. Postgres read every row in orders, kept the 600 that matched, discarded the 99,400 that did not. On a small table that is fine. On a table with fifty million rows, it is not. The fix is an index on total. After creating one, the same query returns:
EXPLAIN ANALYZE SELECT * FROM orders WHERE total > 500;

                          QUERY PLAN
----------------------------------------------------------------------
 Index Scan using orders_total_idx on orders
   Index Cond: (total > 500)
   (cost=0.29..86.40 rows=600 width=132)
   (actual time=0.047..0.612 rows=600 loops=1)
 Planning Time: 0.091 ms
 Execution Time: 0.698 ms
The plan node changed from Seq Scan to Index Scan. Execution time dropped from 18 ms to 0.7 ms. Same data, same result, 26x faster because Postgres now has a cheap way to find the matching rows.
Three signals to read for every EXPLAIN ANALYZE:
- Estimated rows vs. actual rows. If they are off by more than ten, the planner is flying blind and a better estimate from
ANALYZE <table>(the maintenance command, not the EXPLAIN option) will change the plan. - The time spent in each node, bottom-up. A long time in a specific node tells you where the cost actually is.
- Unusual nodes.
Materialize,Hash,Sort, andNested Loopon large inputs are worth a second look.
Level 3: EXPLAIN ANALYZE BUFFERS, the real cost
Execution time is a symptom. The cause of slow execution is usually I/O. Postgres stores tables and indexes in 8 KB pages called buffers. A buffer hit means Postgres found the page in its shared memory cache. A buffer read means Postgres had to go to disk. The difference between those two is multiple orders of magnitude on any real system.
Since PostgreSQL 18, EXPLAIN ANALYZE includes BUFFERS by default. On older versions, turn it on with EXPLAIN (ANALYZE, BUFFERS). Either way, Postgres adds a line to each plan node telling you exactly how many buffers were hit and how many were read from disk.
EXPLAIN (ANALYZE, BUFFERS) SELECT * FROM orders WHERE total > 500;

                          QUERY PLAN
----------------------------------------------------------------------
 Index Scan using orders_total_idx on orders
   Index Cond: (total > 500)
   (cost=0.29..86.40 rows=600 width=132)
   (actual time=0.047..0.612 rows=600 loops=1)
   Buffers: shared hit=72
 Planning Time: 0.091 ms
 Execution Time: 0.698 ms
Seventy-two buffers hit, zero reads. The whole query worked from cache. That is why it was fast.
Now look at a cold version of the same query, run right after a restart before the cache is warm:
 Index Scan using orders_total_idx on orders
   ...
   Buffers: shared hit=4 read=68
   ...
 Execution Time: 8.200 ms
Same plan, same rows, same mean cost estimate. The real-world execution went from 0.7 ms to 8.2 ms purely because the data had to come from disk instead of cache. BUFFERS is the only way to see this difference. Without it, two runs of the same query look unexplainedly different.
Read BUFFERS output like this:
shared hit: pages that were in memory. Cheap.shared read: pages that came from disk. Expensive.shared dirtied: pages modified by the query, waiting to be written back.shared written: pages actually flushed to disk during the query.
A query that reports shared read=40,000 is reading 320 MB from disk. That is the query that actually costs you on a cloud database, because cloud storage I/O is the fee that scales, not CPU. A query that reports shared hit=40,000 read=0 touched the same volume of data but paid for it entirely in memory bandwidth.
When this becomes a workflow problem
EXPLAIN ANALYZE BUFFERS is the right tool for one query. It is the wrong tool for the hundred queries your application runs per request. For that, the signal moves from "analyze this query" to "which of the thousands of queries in flight deserves to be analyzed in the first place."
That is a different question, with a different answer: pg_stat_statements. pg_stat_statements tells you which queries are expensive in aggregate, which are called most often, and which have grown since a deploy. Only once you know which query to look at does EXPLAIN ANALYZE BUFFERS become useful. Running EXPLAIN on every query your app emits is not a workflow. Picking the right one and running EXPLAIN ANALYZE BUFFERS on that one is.
The honest framing: EXPLAIN is for diagnosis. pg_stat_statements is for triage. Do the triage first, then the diagnosis.
Supabase now offers a third thing that is easy to mistake for the diagnosis: the Query Performance report's Indexes tab runs index_advisor on a selected query and reports cost before and after the index it proposes. Those are planner estimates, which is the same currency as plain EXPLAIN and precisely what Levels 2 and 3 above exist to distrust. A recommendation that promises a large estimated improvement is a hypothesis worth testing with EXPLAIN ANALYZE BUFFERS, not a result. The advisor is also documented as recommending single-column B-tree indexes only.
Notes on the output format
Postgres supports FORMAT TEXT, FORMAT JSON, FORMAT YAML, and FORMAT XML. Text is the default and the most compact. JSON is the right format when feeding the output into a tool. A query like:
EXPLAIN (ANALYZE, BUFFERS, FORMAT JSON) SELECT ...;
produces a structured document that can be diffed, stored, or visualized. The website explain.depesz.com takes any text-format output and turns it into a highlighted tree that makes node timing easy to spot. For team review of a hot query plan, paste the output there and share the link.
Closing note
Most performance problems come from a wrong plan on one query. EXPLAIN shows you the plan. EXPLAIN ANALYZE shows you whether the plan behaved. EXPLAIN ANALYZE BUFFERS shows you the real cost that behavior paid. If a query is slow, the first command to run is EXPLAIN (ANALYZE, BUFFERS), not EXPLAIN. The extra information is free once you are already paying the execution cost of the query. If you would rather not chase these plans by hand, Datapace is building a context layer around the database that carries this workload evidence next to business meaning, with a policy gate for what AI may run on production, served to your team. Or book a call to see it on your stack.
Sources
- PostgreSQL documentation, EXPLAIN
- PostgreSQL documentation, Using EXPLAIN
- PostgreSQL documentation, auto_explain
- explain.depesz.com, plan visualizer