You are three days into a new client engagement, the schema has amount, total_amount, and revenue_net in the same table, and the KPI dashboard you were hired to build needs exactly one of them. Nobody on the client side can tell you which one is the source of truth, and the person who added the third column left two years ago.
Staring at column names will not settle it, and neither will a definitions workshop. What settles it is evidence, and gathering that evidence has a procedure: figure out who writes each column, figure out who reads each column, then make the candidates confront each other and a number the client already believes. Work the three evidence classes in that order, because each one is cheaper and more decisive than the next.
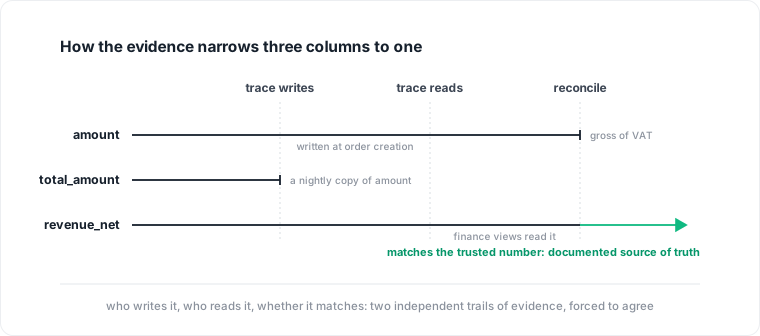
Two independent trails of evidence, forced to agree before you write anything down.
Why the same metric ends up in three columns
Duplicate metric columns are almost never the result of one bad decision. They accumulate, and knowing the common accumulation patterns tells you what to look for:
- Denormalized reporting copies. Someone needed dashboard queries to stop joining five tables, so they added a precomputed
total_amountto the orders table, populated by a nightly job or a trigger. The original computation still exists somewhere else. - Abandoned migrations. A schema redesign introduced
revenue_netwith cleaner semantics, migrated half the write paths, then lost its sponsor. Both columns now receive writes, from different code paths, and neither was ever removed. - Currency and tax variants.
amountis gross in transaction currency,revenue_netis net of tax in the reporting currency, and the conversion logic lives in application code nobody has read since the last VAT change. These are different numbers with confusable names, not duplicates at all. - Application-layer recalculations. The application recomputes a derived value on save and stores it next to the raw inputs. When the derivation logic changes, historical rows keep the old math, so the column means different things depending on when the row was written.
Each pattern leaves different fingerprints, which is exactly what the three evidence classes are designed to find.
Find out which code writes each column
Start with the write path, because the column that the transaction system writes at the moment of business truth usually wins. A column populated when the order is placed, by the code that placed it, is upstream of everything else. A column populated by a nightly job is by definition a copy of something.
Concretely:
- Grep the application code. Search the codebase (or ask the client's developers to) for each column name in INSERT and UPDATE statements, ORM model definitions, and serializers. A column that appears in the core order-creation service is a strong candidate. A column that only appears in a script called
backfill_revenue_v2.pyis telling you a different story. - Check triggers and generated columns. In PostgreSQL, query
information_schema.triggersand look at column defaults and generated-column definitions. A trigger that copiesamountintototal_amounton write settles the direction of dependency immediately: one is source, one is cache. - Check scheduled jobs. Cron jobs, dbt models, ETL pipelines, and materialized view refreshes are all write paths. If
revenue_netis only ever touched by a batch job, find the job's source query. That query is documentation, whether anyone intended it to be or not. - Look at write recency. A column that stopped receiving writes eighteen months ago is not the source of truth for this quarter's dashboard, whatever it used to be.
The heuristic to carry out of this step: prefer the column closest to the business event. Every hop away from the transactional write is a place where logic can drift, jobs can fail silently, and history can freeze.
Sometimes the write path is genuinely ambiguous, two code paths write two columns and neither is obviously canonical. That is fine. You are collecting evidence, not forcing a verdict. Move to the next class.
Find out which reports and queries read each column
The second question is which column the business already treats as real. An organization votes with its queries, and those votes are recorded.
- Read the view definitions. Database views, especially ones with names like
finance_reportingormonthly_summary, encode a previous person's answer to your exact question.pg_viewsin PostgreSQL gives you every definition. If three finance views all readtotal_amount, that column has institutional weight regardless of what the write path says. - Inventory the existing reports. The BI tool's datasets, the exported board deck, the spreadsheet the CFO actually opens: find out which column feeds them. If the number the CEO quotes in investor updates comes from
revenue_net, then switching the new dashboard toamountmeans your dashboard will disagree with the CEO, and you need to be the one who flags that, not the one who discovers it in review. - Check query patterns if you have them. If the database has query logging enabled, or an extension like
pg_stat_statements, you can see which columns appear in real SELECT traffic and from which application users. Heavy read traffic from the reporting service is a signal; zero read traffic from anywhere is a louder one.
Note the failure mode this step protects against: the technically correct answer that nobody uses. If the write-path analysis says amount is the cleanest source, but every existing report reads total_amount, you have not found your answer yet. You have found a discrepancy that the reconciliation step must explain.
Reconcile the columns against each other and a trusted number
Now make the candidates confront each other. This is the step that turns "I think" into "I checked."
Reconcile the candidates against each other. Run the comparison directly:
SELECT
  date_trunc('month', created_at) AS month,
  sum(amount)        AS sum_amount,
  sum(total_amount)  AS sum_total_amount,
  sum(revenue_net)   AS sum_revenue_net,
  count(*) FILTER (WHERE amount IS DISTINCT FROM total_amount) AS mismatched_rows
FROM orders
GROUP BY 1 ORDER BY 1;
The shape of the disagreement is diagnostic. A constant ratio between two columns suggests a tax or currency factor. Agreement until a specific month, then divergence, points to a code change or an abandoned migration, and the deploy history around that month will usually name the culprit. Random row-level scatter suggests a partially failed backfill or a race in dual writes.
Reconcile against a number the client already believes. Every client has at least one trusted figure: last quarter's revenue as reported to the board, the annual number in the audited accounts, the total in the payment provider's dashboard. Compute each candidate column against that anchor. The column that reproduces the believed number, or differs from it by an explainable amount (refunds, tax, timing), is the one your dashboard can defend.
Profile freshness and completeness. For each candidate, check the null rate over time, the most recent populated row, and coverage across segments (does revenue_net exist for all sales channels, or only the ones that went through the new checkout?). A column that is null for 30 percent of last month's rows is not feeding a KPI, whatever its semantics.
When the answer is genuinely "it depends"
Sometimes the investigation ends without a single winner, and the honest finding is that the columns answer different questions. amount is gross transaction-currency revenue at order grain; revenue_net is net reporting-currency revenue at invoice grain. Neither is wrong. This is where most write-ups go soft, and where yours should get more precise instead.
Write the ambiguity down as a decision record, not a shrug. Three things must be explicit:
- Grain. What one row means for each column: per order, per line item, per invoice, per payment. Most "the numbers don't match" escalations are grain mismatches wearing a trench coat.
- Tax treatment. Gross or net, which tax regimes, and as of which date the treatment applies. If the logic changed mid-history, record the cutover date.
- Currency assumptions. Transaction currency or reporting currency, which rate source, and whether the rate is applied at order time or at reporting time.
Then bind each KPI to a column explicitly: "Dashboard revenue = sum of revenue_net at invoice grain, net of VAT, reporting currency, rate at invoice date." One sentence per metric. The point is that when someone in review asks "why doesn't this match the number in Stripe?", the answer is already written, with the delta explained, and the meeting takes five minutes instead of derailing the engagement. Ambiguity that is documented is a definition. Ambiguity that is remembered is a future incident.
Making the answer stick
Here is the uncomfortable part: everything above has a shelf life. Your investigation is correct until the next migration adds a fourth column, the next developer adds a write path your grep never saw, or the batch job feeding total_amount quietly changes its source query. The decision record you wrote is a snapshot, and schemas do not hold still for snapshots. Six months from now, the next analyst (possibly you) starts re-litigating the same question with one more candidate column and one less person who remembers. Interchange standards are starting to give metric definitions a portable format (Apache Ossie entered the Apache Incubator in July 2026), but a format moves definitions between tools; it cannot tell you whether a definition still matches the data.
A better one-time document will not fix that durably. The durable fix is a continuously updated map of your data that says what exists, what it means, how it connects, and whether you can trust it. That is what we are building at Datapace. Datapace is building that map and serving it over an API and MCP, so your team, your integrators, and your AI agents can see what's there, what it means, how it connects, what it costs, and whether they can trust it. For analytics work specifically, the goal is to turn an unknown database into a documented map you can build KPIs on, and to define KPIs on data you can trust, with the lineage to back every number. No more guessing what a column means. That is the hypothesis we are building toward, not a finished product.
If you spend your first week on every engagement reverse-engineering someone else's schema, that is exactly the problem we are building for. Book a call and bring the schema that started the argument.