You have been handed a source system with hundreds of tables, an undocumented database schema, and nobody left who built it. The migration is already scoped, the client is waiting, and your first job is to figure out what this database actually contains before you can map a single field to the target.
This is the least glamorous phase of any ERP migration and the one that decides whether the rest goes well. An ERP integrator we interviewed put data mapping at 10 to 15 percent of total migration project effort and told us it was the hardest, riskiest part of the job. Here is a complete working method for reverse-engineering that schema, Postgres-first, with real queries you can run today. Everything here ports to MySQL, SQL Server, or Oracle: the catalog names change, the method does not.
Why "just look at the tables" fails
Opening a database browser and reading table names feels like progress. It is not, for three reasons.
Naming drift. A table named clients was renamed in the application to "Accounts" five years ago, but the database never followed. A column called temp_flag has driven invoicing logic since 2019. Names record what things meant at creation time, not what they mean now.
Dead tables. Legacy databases accumulate corpses: abandoned features, one-off imports, backups someone made with CREATE TABLE orders_bak_2021. In a decade-old system, it is common to find tables that receive no reads or writes at all. Mapping them wastes effort; worse, migrating them pollutes the target.
Business logic hidden in application code. The database says status is a varchar. Only the application knows that status = '4' means "credit hold" and that records with type_id = 99 are soft-deleted. The schema is half the story; usage is the other half.
So the method is: inventory, infer relationships, decode columns, then validate against usage. In that order.
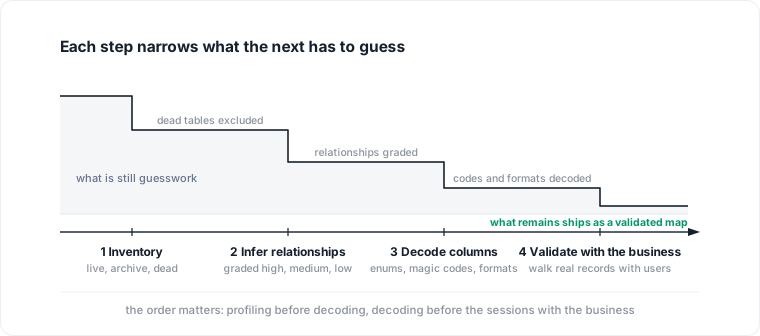
Four steps, in order. Each one narrows what the next step has to guess at.
Step 1: Inventory what exists, and what is alive
Start with a full census. information_schema is portable across engines:
SELECT table_name, count(*) AS column_count
FROM information_schema.columns
WHERE table_schema = 'public'
GROUP BY table_name
ORDER BY column_count DESC;
Then separate live tables from corpses. In Postgres, pg_stat_user_tables tells you which tables actually see activity:
SELECT relname,
       n_live_tup AS approx_rows,
       seq_scan + coalesce(idx_scan, 0) AS reads_since_reset,
       n_tup_ins + n_tup_upd + n_tup_del AS writes_since_reset,
       greatest(last_seq_scan, last_idx_scan) AS last_read,
       last_autovacuum
FROM pg_stat_user_tables
ORDER BY n_live_tup DESC;
Five things matter in that output:
- Row counts.
n_live_tupis an estimate, which is fine; you want orders of magnitude, not audit-grade numbers. Empty and near-empty tables go straight to the "probably dead" pile. - Read and write counters. A table with millions of rows but zero reads since the last statistics reset is a strong candidate for exclusion. Check when the counters were reset (
SELECT stats_reset FROM pg_stat_database WHERE datname = current_database()) so you do not misread a fresh reset as inactivity. - The
coalesceis not decoration.pg_stat_user_tables.idx_scansums over the table's indexes, and a sum over no rows is null, so the column is null for every table that has no index at all. Writeseq_scan + idx_scanand those tables come back null and sort out of view, which is a bad trade: an unindexed table in a legacy schema is a prime dead-table candidate, and this is the query that was supposed to find it. - Last read, not just read count. On PostgreSQL 16 and later,
last_seq_scanandlast_idx_scantimestamp the most recent scan of each kind, sogreatest()of the two answers "when did anything last read this table" directly. That is a sharper signal than a counter, because it survives a low-traffic table that is still load-bearing, and it does not depend on the table having anupdated_atcolumn. On 15 and earlier the counters are all you get. - Recency of writes.
last_readabove tells you when the table was last consulted. For when it last changed, and if the table has acreated_atorupdated_atcolumn,SELECT max(updated_at)tells you when it last mattered. A "current" table whose newest row is from 2020 is telling you something, and a table that is read daily but has not been written to in three years is a lookup table, not a corpse.
Classify every table into live, archive, or dead. Only the first category gets full treatment; the second gets a business decision (migrate as history or leave behind); the third gets documented and excluded.
Step 2: Recover relationships that were never declared
Legacy systems, especially ones built on ORMs or by teams that "handled integrity in the app," frequently have few or no declared foreign keys. First, list what is declared, then find the gap. This query surfaces columns that look like foreign keys but have no constraint:
SELECT c.table_name, c.column_name
FROM information_schema.columns c
WHERE c.table_schema = 'public'
  AND c.column_name LIKE '%\_id'
  AND NOT EXISTS (
    SELECT 1
    FROM information_schema.table_constraints tc
    JOIN information_schema.key_column_usage kcu
      ON tc.constraint_name = kcu.constraint_name
     AND tc.constraint_schema = kcu.constraint_schema
    WHERE tc.constraint_type = 'FOREIGN KEY'
      AND tc.table_schema = c.table_schema
      AND kcu.table_name = c.table_name
      AND kcu.column_name = c.column_name
  );
Two details in that query earn their keep. NOT EXISTS rather than NOT IN, because a single null anywhere in a NOT IN list makes the whole predicate return nothing, and a query that silently returns zero rows is the worst possible failure mode for a discovery step. And the schema is matched on both sides, so a foreign key declared on a same-named table in another schema does not mask a real gap. The \_ in the pattern is an escaped underscore, so %\_id matches customer_id but not paid.
Everything that comes back is a hypothesis, not a fact. You confirm hypotheses three ways.
Naming conventions, and where they betray you
customer_id in orders probably points at customers.id. Probably. Naming inference fails in predictable places:
- Polymorphic references. A column pair like
owner_idplusowner_typepoints at different tables depending on the row. No single join target exists, and Odoo'sres_idplusres_modelpattern is exactly this. Treat any*_idcolumn that sits next to a*_typeor*_modelcolumn as polymorphic until proven otherwise. - Denormalized copies.
customer_idin aninvoice_linestable may be a cached copy that drifted from the header. Same name, weaker guarantee. - Renamed targets.
client_idpointing at a table now calledaccounts, because the rename never propagated.
Value-overlap profiling, without hammering production
The real test of a hypothesized relationship is referential: do the values in the child column exist in the candidate parent? Do not run this as a full-table anti-join on a busy production system. Sample instead:
SELECT count(*) FILTER (WHERE c.id IS NULL) AS orphans,
       count(*) AS sampled
FROM (
  SELECT customer_id
  FROM orders TABLESAMPLE SYSTEM (1)
  WHERE customer_id IS NOT NULL
) s
LEFT JOIN customers c ON c.id = s.customer_id;
A 1 percent sample is usually enough to distinguish "this is a real relationship with a few orphans" from "these columns have nothing to do with each other." Run profiling against a restored backup or a read replica when one exists; when it does not, sample small, run during quiet hours, and set statement_timeout so a mistake cannot pile up.
Orphan rates matter beyond confirmation. A hypothesized relationship with 3 percent orphans is both a confirmed join and a data-quality finding you must resolve before load, because the target ERP will enforce the integrity the source never did.
Mine the joins the system actually performs
The most reliable witness to the real data model is the workload itself. If the pg_stat_statements extension is installed, it holds a record of the queries the application actually runs, including every join path the developers considered correct:
SELECT query, calls
FROM pg_stat_statements
WHERE query ILIKE '%join%'
ORDER BY calls DESC
LIMIT 50;
You are not reading this for query optimization. You are reading it as documentation: a join that runs thousands of times a day is a relationship the business depends on, whatever the constraints say. Application source code, if you have it, serves the same purpose. Search the ORM models and raw SQL for join conditions, and pay attention to joins on columns your naming inference never flagged, such as joins on composite business keys or on columns with unrelated names.
Assign a confidence level to every inferred relationship
This is the discipline that makes the map usable by the rest of the team. Every edge in your relationship map gets a grade:
High
- Criteria
- Declared FK, or naming match plus clean value overlap plus observed in the workload
Medium
- Criteria
- Naming match plus value overlap, but never observed in queries or code
Low
- Criteria
- Naming match only, or partial overlap with unexplained orphans
High-confidence edges feed the field mapping directly. Medium ones get verified in the validation step below. Low ones are open questions for the client, not silent assumptions in your migration scripts. When something breaks during a trial load, the confidence column tells you where to look first.
Step 3: Infer what columns mean from the data itself
With the graph in place, decode the columns. Postgres keeps distribution statistics that answer most first questions without touching the table:
SELECT attname, n_distinct, most_common_vals
FROM pg_stats
WHERE schemaname = 'public' AND tablename = 'orders';
Two conditions before you trust what comes back. pg_stats exposes only the rows for tables the current role may read, so a read-only account scoped to part of the schema returns a partial picture that looks like a complete one; run it as a role that can read everything you are mapping, or grant pg_read_all_stats. And the numbers come from the last ANALYZE, so on a restored backup that nobody has analyzed, the view is empty or stale.
What to look for:
- Cardinality. A varchar with
n_distinct = 7is not free text, it is an enum hiding in a string column.GROUP BYit, count each value, and you have its domain. Read the sign before the number: a positiven_distinctis a count, a negative one is the count divided by the row count, so-1means every value is unique and-0.5means each value appears about twice. An enum shows up as a small positive number, never as a negative one. - Magic codes. Numeric status columns with a handful of distinct values (
1, 2, 3, 4, 99) encode workflow states defined only in application code. List them with row counts; the decoding happens by asking the people who use the system daily. - Formats. Profile a sample with regex checks: is this "text" column actually always an email, an IBAN, a date stored as
DD/MM/YYYYstrings? Format drift within one column (two date formats, mixed casing of codes) is a transformation task you want in the estimate, not in the go-live weekend. - Null patterns. A column that is null for 95 percent of rows but always populated for one
type_idtells you two record types share one table, which usually means two target models in the ERP.
Step 4: Validate the map with the business, not the DBA
Here is the step most guides skip, and the one that saves migrations. The DBA (if one exists) can confirm structure. They usually cannot tell you what status = '4' means to the accounting team, because meaning lives in usage, not in the schema.
So take your draft map to the people who use the system daily, and walk key records end to end. Sit with an order administrator and trace one real order: the customer record, the lines, the delivery, the invoice, the weird correction entry from last March. Ask them to narrate what each screen shows, and match it against your tables. Walking a handful of well-chosen records with a daily user surfaces the corrections that solo profiling tends to miss: fields repurposed years ago, "everyone knows" conventions like negative quantities meaning returns, and the manual workaround that lives in a spreadsheet because the system never supported it.
Do this before you write mapping specs. Every medium-confidence relationship and every magic code list from step 3 goes on the agenda for these sessions.
Where this fits in the migration timeline
Schema reverse-engineering belongs at the very front, during scoping, before the quote is final if you can manage it. The output is a source data model document: table census with live/archive/dead classification, relationship map with confidence levels, column dictionary with decoded enums, and a data-quality findings list (orphans, format drift, duplicates). That document is what makes your source-to-target mapping document estimable, your transformation scripts testable, and your trial loads explainable when they fail. Skipping it does not remove the work; it moves the work into the load phase, where every surprise costs more.
Stop reverse-engineering undocumented schemas by hand
Everything above is doable manually, and experienced integrators do it on every project. It is also systematic enough that most of it should not be manual. This is the problem we are building Datapace for: database-specific AI agents that work from one graph documenting the entities in a system, the relationships between them, what they mean, and the infrastructure around them, whatever engine the source runs on. For a migration team the aim is the output of this article, produced for you and proposed for your approval rather than asserted: the table census with its live, archive and dead classification, the relationship inference with the confidence grades attached, the decoded columns, and the data-quality findings that decide your load order. Every one of those is a judgment a person should sign, which is why they arrive as proposals. The goal we are building toward is mapping a source system to Odoo in days rather than weeks. We are running pilots, and the work began in Vector Institute's DaRMoD Summer 2026 cohort.
If you spend the first weeks of every migration rebuilding someone else's undocumented schema, we would like to compare notes with you. Read how we approach the reprise de données problem, or start from the ERP data migration use case and tell us about your worst source system.