Every team that ships schema migrations runs them through staging first. On April 10, 2026, a widely-shared post-mortem reported a migration that took eight seconds against a 10,000-row staging table and four hours and twelve minutes against the 84-million-row production copy of the same table. The SQL was identical. The Postgres version was identical. Nothing about sync or configuration drift explains the gap in that comparison. Staging is a sampling estimator of production, and the error term is unbounded in the direction you care about.
TL;DR. Staging tells you whether the migration parses. It does not tell you how long the lock will be held. Sampling bias drives the gap between staging behavior and production behavior, it grows with table size and concurrent reader count, and it is the largest source of under-estimation in schema-migration risk review. The fix is testing against production-shaped data plus context on what production actually looks like: row counts, the lock graph, concurrent load.
The estimator that got it wrong by 1,890x
The incident report covers a single-line migration:
ALTER TABLE users
  ADD CONSTRAINT users_phone_number_check
  CHECK (phone_number IS NOT NULL);
The column phone_number had existed on the table since its creation. The constraint was being added retroactively to enforce an invariant the application already assumed. In staging, the statement completed in 8 seconds against 10,000 rows. The engineer merged. In production, against 84 million rows, the same statement acquired ACCESS EXCLUSIVE on the users table and held it for 15,120 seconds.
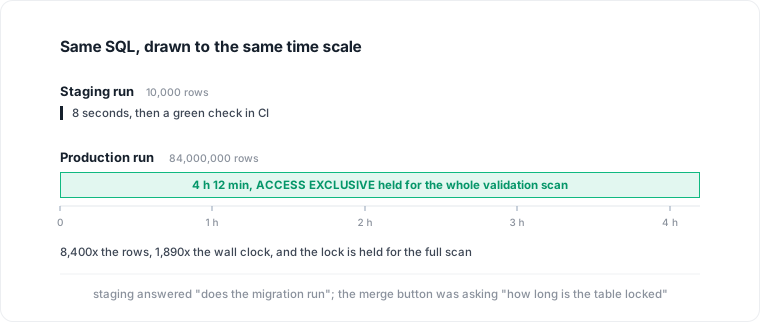
Staging and production ran the same DDL. The bias in the comparison is the point.
Postgres documents this behavior explicitly. The ALTER TABLE reference notes that adding a CHECK or NOT NULL constraint "requires scanning the table to verify that existing rows meet the constraint," and unless otherwise noted, ADD CONSTRAINT acquires ACCESS EXCLUSIVE for the duration of that scan. Scan time is roughly proportional to row count and I/O throughput. The 8,400x row-count difference between staging and production produced a 1,890x wall-clock difference, and because the lock is held for the scan, that is how long production was locked for reads and writes.
The mechanical fix for this specific statement is well-known. Use ADD CONSTRAINT ... CHECK (...) NOT VALID, which skips the scan and acquires the lock for constant time. Then issue VALIDATE CONSTRAINT in a separate transaction, which acquires SHARE UPDATE EXCLUSIVE rather than ACCESS EXCLUSIVE and does not block readers or writers. Every Postgres engineer who has read the ALTER TABLE docs closely knows this. The engineer who merged the migration almost certainly does too.
The question the post-mortem does not answer, and the one worth asking, is why staging returned "8 seconds" as useful evidence at all.
Staging is a sampling estimator, not a copy
The common framing of staging is "a copy of production that lags behind." That framing assumes the correct response to a miss is better sync: freshening the data more often, matching extensions and collations, keeping feature flags aligned. All of that is real work and some of it is worth doing. None of it addresses the incident above.
The accurate framing is that staging is a statistical estimator. Specifically, it is a small sample of production state against which operations are run as a prediction of how the same operations will behave against the full distribution. The sample is never the full distribution. For most production distributions it cannot be. Staging is smaller on purpose, to contain PII, to cost less, to reset cleanly between CI runs. The sample is biased by design.
The academic framing that names this cleanly comes out of Alibaba's VLDB 2020 paper on intermittent slow queries in cloud databases. The authors found that production cloud databases exhibit cost behavior that is not predictable from test-environment traces alone, and proposed a framework, iSQUAD, that attributes production slowness using patterns a staging trace would not contain. The generalization that matters here is that any operation whose cost is a function of the distribution of production state, which includes every index build, every table scan, every lock acquisition, is in scope for this bias. Staging returns a point estimate from a skewed sample.
Three axes where the estimator is biased
The bias has three dimensions, and the April 10 incident happened to hit all of them at once.
Row count. The post-mortem reports 10,000 staging rows and 84 million production rows, an 8,400x factor. For operations whose cost is O(rows), this is the whole story. CREATE INDEX without CONCURRENTLY, ADD CHECK without NOT VALID, VACUUM FULL, CLUSTER, and any UPDATE or DELETE that rewrites the table. The wall-clock estimate from staging is wrong by up to the row-count ratio. It is never wrong in the other direction.
Lock-graph state. Staging runs migrations against an empty or near-empty lock graph. No long-running analytical queries are holding ACCESS SHARE on the target table. No other transactions are in the middle of writes that would conflict. Production hosts a continuous stream of reads, writes, and long-running jobs, and any of them can hold a lock that queues the migration behind it. When the migration queues, every subsequent read queues behind the migration, because Postgres will not let new readers jump the waiting writer. Staging cannot reproduce this because there is nothing holding locks in staging. The estimator returns "acquired immediately" every time.
Concurrent reader count. The cascade in the April 10 incident, and in Railway's December 2025 incident, ended up saturating the connection pool because waiting readers accumulated while the lock was held. Railway's October 2025 incident drained the same pool from the other side, since a non-CONCURRENTLY index build holds SHARE and blocks writes rather than reads. Staging has one reader: the test harness. Production has hundreds to thousands. The cost of holding a lock for four hours on a table nobody is reading is four hours of inconvenience. The cost of holding that lock on a table that serves ten thousand requests per minute is an outage with a bill attached.
What staging measures
- Row count
- 10,000 sampled rows
- Lock graph
- Empty or near-empty
- Concurrent readers
- 1 (the test harness)
- I/O profile
- Warm cache, small heap
- State freshness
- Stale by hours or days
What production exposes
- Row count
- 84,000,000 live rows
- Lock graph
- Active readers and writers
- Concurrent readers
- Hundreds to thousands
- I/O profile
- Cold pages, contended buffer pool
- State freshness
- Real-time
Why making staging bigger does not fix this
The reflex response to a staging-production gap is to close it by making staging more like production. Clone production nightly. Run anonymization pipelines that retain the distribution. Replay recorded traffic against staging during CI runs. These are legitimate engineering exercises, and for some classes of regression they are useful. For lock-graph behavior they do not work, for four reasons.
Cost. Running a cloned production database around the clock doubles the database bill. For companies with multi-terabyte Postgres, this is not a rounding error. Most engineering orgs that tried this in 2020 through 2023 walked it back.
PII. Anonymization of a full production clone is a multi-quarter compliance project. The anonymization itself produces row-distribution changes that re-introduce the bias on a different axis. Columns become null-heavy, foreign-key distributions shift, skew patterns disappear. The staging clone now behaves differently from production for reasons that look like success on the data-privacy dashboard.
Write load. Even a full clone is static. The lock graph at any moment on production is a function of the current write and read stream, which CI cannot reproduce without mirroring production traffic into the staging database. Mirror the traffic and staging becomes a second production, which means paying for two of them and absorbing the operational weight of both.
Freshness. A production clone taken at 02:00 does not see the 14:00 long-running job that was going to queue behind the migration. The lock graph is stochastic and current. Every hour of lag on the clone is an hour of lock-graph state the sample does not contain.
None of the four is solvable by spending more on staging. They are structural, and they all point at the same missing piece: context about live production state at the moment the migration merges.
The class of checks that do close the gap
A pre-merge check in any CI that catches the April 10 incident does not need a bigger staging. It needs three pieces of production context, read through a connection with read-only SQL permissions or a scoped admin role:
- The row count and approximate size of the target table, from
pg_classandpg_stat_user_tables. One query, milliseconds. - The current lock graph on the target table, from
pg_locksjoined topg_stat_activity. Flags readers and writers that are currently holding locks the migration will need, and how long they have been holding them. - A cost model for the specific DDL against the observed row count. For
ADD CHECK, that model is approximately row count divided by per-row validation rate on the target instance, which can be calibrated against recentVACUUMor index-build timings.
With those three pieces, a check in any CI can flag the migration while it is still in review. Applied to the April 10 migration, the flag would have read something like this.
# pre-merge schema check (illustrative)
FLAG · PR #1712 (migrations/0082_add_phone_check.sql)

  DDL         ALTER TABLE users ADD CONSTRAINT ... CHECK (phone_number IS NOT NULL)
  Lock level  ACCESS EXCLUSIVE on users (84,000,000 rows, 72 GB)
  Cost model  full-table validation scan, ~1,500 to 5,000 sec
              held under ACCESS EXCLUSIVE for the scan duration
  Observed    3 readers on users with ACCESS SHARE held for >60 s
              (pids 24181, 24902, 25036)
  Assessment  unsafe as written · staging estimate (8 s) is biased 8,400x
              against production row count (84M vs 10K)
  Fix         rewrite as:
              ALTER TABLE users ADD CONSTRAINT ... CHECK (...) NOT VALID;
              -- then, in a separate transaction:
              ALTER TABLE users VALIDATE CONSTRAINT users_phone_number_check;
The flag does two things the staging run cannot. It reports the estimate from production, not from the sample. And it arrives before the merge, at the point where the fix is free.
The check is probabilistic, not deterministic
Production state shifts. The long-running query holding ACCESS SHARE when the check runs may have finished before the merge button is clicked. The row count used for the cost estimate is right within a few percent for most tables and wrong by orders of magnitude for partitioned tables where the active partition does not match the whole-table statistic. The estimate has an error bar and will sometimes flag migrations that would have applied cleanly.
That is fine. The check is ranking, not gatekeeping. It flags the highest-risk migrations at the earliest point where a human can reconsider at near-zero cost. That is a different job than staging, and neither replaces the other. Staging tells you whether the migration parses and whether application tests pass against the new schema. The check tells you whether the production-side cost is survivable. Both layers are cheap. Only one of them scales with row count.
Complementary guardrails
A pre-merge check does not replace the runtime safeguards that shorten an incident once it starts. lock_timeout of a few seconds on DDL so a queued migration aborts instead of holding the queue open. statement_timeout as a backstop on application queries so a single slow reader cannot hold ACCESS SHARE for minutes. A deploy window that refuses DDL when traffic on the target table is above a threshold. A scoped admin role with reserved connections outside the pool the application uses. These are complements, not substitutes. The check decides whether the DDL should merge. The guardrails decide how bad it can get if it does.
Closing note
The April 10 migration was correct SQL. Staging was not broken. What went wrong is that a staging run returned "8 seconds" and nobody pointed out that "8 seconds" is not what the merge button was asking about. The merge button was asking "will the production database be fine after this ships," and staging does not have production's row count, production's lock graph, or production's concurrent reader count. It never will. Staging was designed to answer a different question, and it answers that one fine.
The structural fix is a second layer of evidence: production-shaped data for the cost estimate, plus context on what production actually looks like (row counts, the lock graph, concurrent load) at the moment the change is reviewed. That context is what any pre-merge migration check has to know, whether a team wires one into CI or an agent asks before acting. Datapace is building the context layer between your databases and your AI: resolved meaning validated by the people who own the data, the workload evidence beside it (cost, performance, usage and freshness, lineage), and a policy gate over what an agent may do and access, served over MCP. The staging run remains useful evidence that the migration parses and runs. It stops being usable evidence the moment the production row count diverges by more than a factor of ten. If you want to compare notes on your own migration pipeline, book a call.
Frequently asked questions
Why does ADD CHECK not take a metadata-only lock like ADD COLUMN on Postgres 11 and later?
Because CHECK must verify that every existing row satisfies the constraint, and the docs are explicit that this requires scanning the table. ADD COLUMN with a nullable default skips the scan because nullability is trivially true for the absent column. The NOT VALID variant skips the scan.
If I use NOT VALID, do I still get the CHECK protection on new writes?
Yes. NOT VALID applies the constraint to every row inserted or updated after the DDL completes; only pre-existing rows are unchecked until you run VALIDATE CONSTRAINT. Validation takes SHARE UPDATE EXCLUSIVE, which is compatible with reads and writes.
Can we just test migrations against a production clone?
For row-count-driven cost, a fresh clone gets you most of the way. For lock-graph behavior, no: the lock graph is a function of current read and write traffic, not state. A clone taken at 02:00 does not reflect the 14:00 reader that will queue your migration.
What about shadow-table migration tools like pgroll, pg_osc, or gh-ost?
Online DDL tools change the execution path through shadow tables, triggers, or versioned views. They are useful, and they do not catch every case where DDL acquires ACCESS EXCLUSIVE on the main table. They complement a pre-merge lock-graph check, which runs before the tool choice matters.
Is lock_timeout on the DDL not enough?
lock_timeout is correct and necessary. It caps the waiting window so a queued DDL aborts after N seconds instead of holding the queue open for hours. It does not prevent the DDL from being a timeout candidate in the first place. A pre-merge check shifts the decision earlier. The two layers stack.
Sources
- Postmortem Files, "The Database Migration That Locked Production for 4 Hours (Complete Postmortem)", Medium, April 10, 2026.
- PostgreSQL documentation, ALTER TABLE (current version).
- PostgreSQL documentation, Chapter 13.3, Explicit Locking (current version).
- Andrew Farries, "Schema changes and the Postgres lock queue", Xata, June 18, 2024.
- Railway, Incident report, October 28, 2025.
- Railway, Incident report, December 8, 2025.
- M. Ma, Z. Yin, S. Zhang et al., "Diagnosing Root Causes of Intermittent Slow Queries in Cloud Databases", PVLDB 13(8), 1176-1189, 2020.