TL;DR. We loaded the same 50 million orders into Postgres 18 (row store) and DuckDB 1.4 (column store) on one machine and measured both workload classes instead of describing them. The row store served point lookups in 0.03 ms and 155,000 concurrent reads per second; the column store needed 0.22 ms per lookup on a single connection. The column store ran a filtered aggregation 46 times faster (99 ms vs 4.5 s) and stored the same rows in 791 MB vs 4.5 GB. Then we ran both workloads on the same Postgres instance at once: throughput held, but the worst single update went from 38 ms to 332 ms, and transactions over 10 ms went from a few dozen per minute to 155 and 270. That tail is the problem HTAP architectures exist to solve, and every one of them pays for it in freshness, memory, or write amplification.
OLTP, OLAP, and HTAP are usually explained with adjectives: one is "optimized for transactions", the other "for analytics", and HTAP "does both". Adjectives do not size a decision. So we put the same 50 million rows through Postgres 18.4 and DuckDB 1.4.5 on the same machine and measured the four numbers that actually separate the categories: point-operation latency, concurrent write throughput, full-scan aggregation time, and what happens to your latency tail when one box serves both workloads. The short version: the gap ranges from 1.7x to 46x depending on the query, and the cost of co-location shows up in your worst second, not your average one.
OLTP, OLAP, HTAP: three names for where the bytes sit
OLTP (online transaction processing) is the workload of applications: fetch one order, update one balance, insert one event, thousands of times per second, each touching a handful of rows. OLAP (online analytical processing) is the workload of questions: revenue by region by month, top customers this quarter, each touching millions of rows but few columns. HTAP (hybrid transactional/analytical processing) is the promise of serving both from one system; the term comes from a 2014 Gartner research report (source).
What actually separates the first two is where bytes sit on disk. A row store like Postgres keeps each row's columns adjacent inside an 8 KB page, so reading or writing one order touches one page, and a B-tree gets you to that page in microseconds. A column store keeps each column contiguous and compressed, so an aggregate over two columns reads two dense segments and skips the other five, while fetching one full row means visiting every segment.
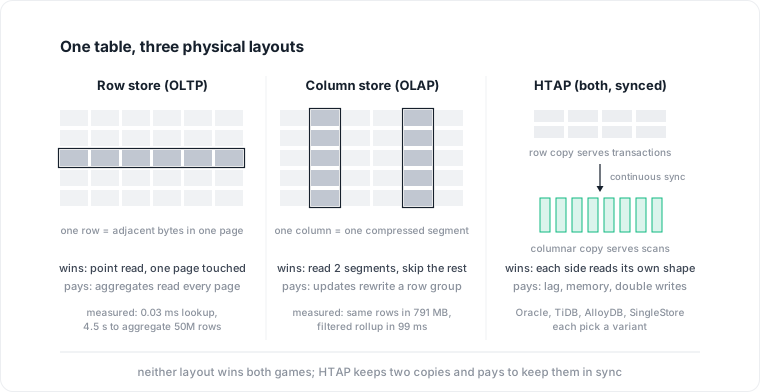
One table, three physical layouts. The shaded cells are the bytes each layout actually reads for its favorite operation; the pays line under each panel is what it gives up on its least favorite one.
Neither layout can win both games, because the two access patterns want opposite things from locality. That is the whole category divide. HTAP systems do not repeal it; they keep two representations and synchronize them, which moves the cost rather than deleting it.
The benchmark rig: 50 million rows in Postgres 18 and DuckDB 1.4
Every number below comes from one machine: a MacBook with an Apple M5 (10 cores, 24 GB RAM), Postgres 18.4 with shared_buffers = 4GB, max_parallel_workers_per_gather = 4, synchronous_commit = on, and DuckDB 1.4.5 with its default 10 threads. The table is 50 million synthetic orders across 5 million customers, 12 regions, 5 statuses, and an 18 month date span. Rows are derived from the row number by multiply-and-modulo arithmetic, so the dataset is exactly reproducible with no random seed:
CREATE TABLE orders (
  order_id    bigint        NOT NULL,
  customer_id integer       NOT NULL,   -- (i * 2654435761) % 5000000
  region_id   smallint      NOT NULL,   -- (i * 40507) % 12
  status      text          NOT NULL,   -- 5 values, (i * 97) % 5
  items       smallint      NOT NULL,   -- 1 + (i * 31) % 9
  amount      numeric(10,2) NOT NULL,   -- 10.00 to 999.99
  created_at  timestamptz   NOT NULL    -- 2025-01-01 + up to 548 days
);
Postgres stores this in 3.4 GB of heap, its main table file, plus a 1.1 GB primary key index. The same rows exported to CSV weigh 2.9 GB, and DuckDB ingests that CSV in 2.9 seconds into a 791 MB file: columnar encoding compresses this table 5.7x against the row-store footprint. Both engines return the identical 240-group result for the rollup query below, which is the sanity check that we are comparing the same work.
Two disclosures before the numbers. First, this is a laptop microbenchmark: the working set fits in memory, the SSD is fast, and nothing else is running, so treat the ratios as direction, not as capacity planning. Second, the two engines have different concurrency and durability designs (Postgres takes concurrent writers and flushes its write-ahead log, the WAL, to disk on every commit; DuckDB is a single-writer embedded engine), so cross-engine transactional numbers describe architectural shape rather than a fair race.
What the row store wins: OLTP concurrency on small operations
The OLTP side runs two workloads against Postgres under pgbench, its built-in benchmark driver: a primary key lookup and a durable single-row UPDATE, both with uniformly random keys over all 50 million rows. DuckDB runs the same operations from a single connection, first with no index (its natural analytical posture, where stored per-block minimum and maximum values let it skip blocks that cannot contain the key), then after building a unique index on order_id, which took 1.7 s.
| Same operation, same 50M rows | Postgres 18, client-server | DuckDB 1.4, embedded |
|---|---|---|
| Look up one order by id (single client) | 0.029 ms | 0.224 ms with an index, 0.422 ms without |
| Point lookups per second (8 parallel clients) | 154,974/s | one process, no parallel clients: 4,458/s |
| Durable single-row update | 0.605 ms each, 13,225/s across 8 clients | 0.264 ms each, 3,791/s, single writer |
The per-operation gap is about 8x (0.029 ms vs 0.224 ms), and it widens to 35x the moment concurrency matters, because Postgres happily serves eight clients at 155,000 lookups per second while an embedded column store serves one process. DuckDB's single-connection update number looks respectable in isolation, but it is not the same product: there is no concurrent write path to contend for. This is the shape of the OLTP category: many small, indexed, concurrent, durable operations, and a row store built around exactly that.
What the column store wins: OLAP scans, by 1.7x to 46x
The OLAP side is two queries. Q1 is a full-table rollup: orders, revenue, and average basket by region and month, 240 output groups. Q2 is a filtered ranking: top 10 customers by spend since January 2026, excluding returned orders, which forces a hash aggregate over up to 5 million customer groups.
| Same query, warm cache | Postgres 18, 4 workers | DuckDB 1.4, 10 threads | Column-store gap |
|---|---|---|---|
| Q1: revenue rollup by region and month (240 groups) | 2.3 s (8.1 s cold) | 1.39 s | 1.7x faster |
| Q2: top 10 customers since January (filter, 5M groups) | 4.5 s | 99 ms | 46x faster |
Q1 is the honest surprise: with the heap fully cached, four parallel workers, and only 240 groups, Postgres is within a factor of two of a vectorized column store, because the query is compute-bound on timezone-aware date_trunc over every row rather than I/O-bound. Columnar formats are not magic on that shape. Q2 is where the layout shows its teeth: the created_at filter lets DuckDB skip most row groups (its storage blocks) using min-max metadata, it reads three columns instead of seven, and its vectorized hash aggregate chews through millions of groups. Same table, same engine pair, and the advantage swings from 1.7x to 46x. When someone quotes you a single "columnar is Nx faster" figure, they have chosen the query for you.
Here is what the row store is actually doing during Q1, from EXPLAIN (ANALYZE, BUFFERS):
Finalize GroupAggregate (actual time=2506.422..2521.444 rows=240.00 loops=1)
  Buffers: shared hit=389100 read=50958
  -> Gather Merge (actual time=2506.393..2520.971 rows=1200.00 loops=1)
       Workers Planned: 4
       Workers Launched: 4
       -> Parallel Seq Scan on orders
            (actual time=0.050..1668.863 rows=10000000.00 loops=5)
Execution Time: 2521.529 ms
Five processes read 440,000 buffers, which is the entire 3.4 GB heap, to aggregate three columns. The column store reads roughly the compressed segments of those three columns instead. That asymmetry in bytes touched, about 20x for a typical wide table, is the entire OLAP category in one sentence.
Row store profile (measured)
- Point lookup
- 0.03 ms
- Concurrent reads
- 155,000/s at 8 clients
- Durable updates
- 13,225/s at 8 clients
- Rollup, 50M rows
- 2.3 s warm, 8.1 s cold
- Filtered top-10 query
- 4.5 s
- On-disk size
- 4.5 GB with index
Column store profile (measured)
- Point lookup
- 0.22 ms, single process
- Concurrent reads
- one process serves everything
- Updates
- single writer only
- Rollup, 50M rows
- 1.4 s warm
- Filtered top-10 query
- 99 ms
- On-disk size
- 0.79 GB
Co-location on one Postgres box taxes the tail, and HTAP exists to pay that tax back
The interesting question for a team without a data warehouse is not which engine wins which benchmark. It is: what does it cost to just run the dashboards on the primary? So we measured it, the way the definitional articles never do. Protocol: five 60-second phases on the same Postgres instance, alternating baseline and contention, with checkpoints between phases. The OLTP side is 8 pgbench clients doing durable single-row updates. The contention is the Q1 rollup running in a loop on one connection, then on three.
| Phase (run order) | Updates/s | p50 | p99 | p99.9 | Worst single update | Updates over 10 ms |
|---|---|---|---|---|---|---|
| Baseline | 6,874 | 1.18 ms | 2.81 ms | 4.72 ms | 37.9 ms | 32 |
| + 1 scan loop | 11,369 | 0.22 ms | 2.61 ms | 5.34 ms | 332 ms | 155 |
| Baseline | 5,446 | 1.23 ms | 3.08 ms | 6.69 ms | 13.2 ms | 3 |
| + 3 scan loops | 7,271 | 1.09 ms | 4.28 ms | 8.61 ms | 58.5 ms | 270 |
| Baseline | 6,666 | 1.19 ms | 3.36 ms | 6.65 ms | 27.1 ms | 47 |
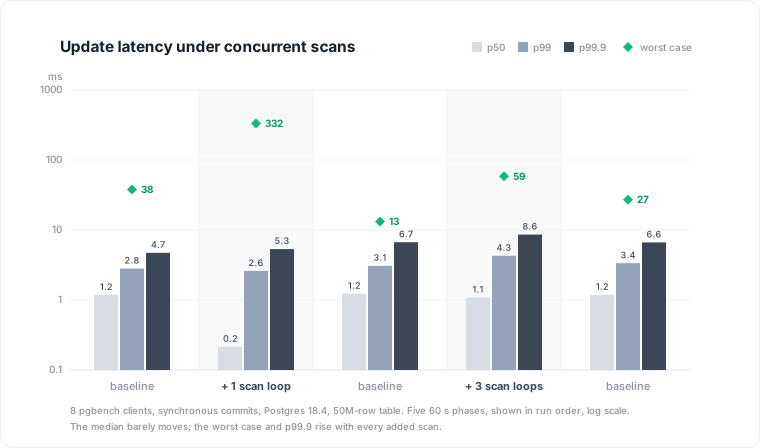
The five phases in run order. Baselines wobble between 5,400 and 6,900 updates per second because the table keeps absorbing updates and the dead row versions they leave behind; the signal that survives the noise is in the diamonds and the rightmost bars.
Two results, and neither is the one the folklore predicts. First, throughput never collapsed. With one concurrent scan it went up, and the median dropped to 0.22 ms, which is consistent with WAL group commit: when scans occupy cores, more commits queue behind each flush and share it. Second, the tail degraded anyway, and monotonically with dose. Every contended phase set the experiment's record for transactions over 10 ms (155 and 270, against 3 to 47 in baselines) and for worst case (332 ms and 58.5 ms, against 13 to 38 ms). Eight transactions crossed 100 ms during the single-scan phase. Averages hid all of this; the p99.9 and the max carried the story.
Throughput survived co-location in every phase. The tail did not: one concurrent analytical scan turned a 38 ms worst case into 332 ms.
The damage also runs the other way. Solo, the warm rollup takes 2.3 s. During the three-loop phase, with the update stream running, the same rollup took a median of 5.7 s and a worst case of 10.6 s across 29 runs. Analytics on the primary is slower analytics and spikier transactions at the same time.
One honesty note, and it makes the case stronger rather than weaker: this box had idle cores and the whole table in cache, which is the gentlest possible version of co-location. On a production primary the working set exceeds memory, so scans evict the buffers your point queries need, and the tail numbers above are the floor, not the ceiling.
Four production HTAP systems, four places the columnar copy lives
Every credible HTAP design keeps a row representation for transactions and a columnar one for scans, then differs on where the columnar copy lives and how it stays fresh. The four patterns in production today:
| System | Columnar copy lives | Kept fresh by | The cost you pay |
|---|---|---|---|
| Oracle Database In-Memory | In RAM, beside the buffer cache | Dual-format maintenance on write | Memory for a second copy |
| TiDB with TiFlash | Separate columnar replicas | Changes stream to the columnar replicas (Raft learners); reads wait for them to catch up | Extra nodes, replication lag on the wire |
| AlloyDB columnar engine | In instance memory, 30% by default | Refresh jobs; updates invalidate columnar blocks | Staleness between refreshes |
| SingleStore universal storage | One hybrid table: memory segment plus columnstore | In-memory segment flushes; column group index for row access | Write amplification inside the table |
The Postgres ecosystem is converging on the same shape from below: pg_duckdb embeds DuckDB's vectorized engine inside Postgres so analytical queries run columnar-style over the same tables, and every managed vendor's "run analytics without touching the primary" feature is a variation on the replica-plus-columnar theme. Databricks pushed the idea furthest in June 2026 by coining LTAP: Postgres transactions materialized into open columnar formats below the engine, in the lake itself, which we take apart in a companion analysis. None of these repeal the trade; they relocate it. You are buying our measured 99 ms scan without our measured 332 ms outlier on the write path, and you pay with the sync machinery, the second copy, and a freshness lag you must now monitor. The engineering-honest framing of why many teams still just pair an OLTP store with a separate columnar store over change data capture (CDC) is that HTAP moves the ETL inside the database, where it becomes someone else's carefully tested code instead of your cron job.
How to choose between OLTP, OLAP, and HTAP, using your own tail instead of a vendor's adjective
The decision reduces to three questions: how fresh must analytics be, how strict is your OLTP latency budget, and who operates the result.
- Reports can be minutes old, primary is busy: run analytics on a read replica or a nightly export. This is most teams, and it is boring on purpose. pg_stat_statements will tell you when dashboard-shaped queries start showing up on the primary anyway.
- Dashboards on live data, modest scale, tolerant tail: co-locate, deliberately. Our numbers say a cached 50M-row rollup costs single-digit extra milliseconds at p99.9 and a worst case up to 9x higher. If your SLO can absorb that, one database is operationally cheaper than two.
- Sub-second analytics on live data, strict OLTP SLOs: this is the actual HTAP use case (fraud checks, live personalization, operational dashboards at scale). Pick a dual-representation system from the table above, or CDC into a columnar store and accept seconds of lag you control.
- Agent traffic is changing the mix: LLM agents ask analytical-shaped questions of transactional databases, a
GROUP BYover 50 million rows fired at the primary because the model neither knows nor cares which workload class the box serves. If agents can reach your database, read-only is not the same thing as safe, and workload class belongs in the policy, not in the model's goodwill.
These numbers are one laptop, one dataset shape, one pair of engines, and your cardinalities, cache hit rates, and hardware will move every figure. The protocol travels better than the results: thirty lines of pgbench and a scan loop will produce your tail table on your workload in an afternoon, and that table, not a category label, is the thing to decide from.
Where Datapace fits
Datapace sits on a different axis than the engines in this post: not where your workloads run, but how well anyone understands the base they run on. We are building a context layer around production databases: what is there and what it means, the workload evidence beside it (cost, performance, usage, freshness), and a policy gate over what AI may run, exposed to humans and AI agents over an API and MCP interface, across engines. A base that explains itself turns decisions like row versus column versus both into an afternoon instead of an archaeology project, and it is how an agent finds the monthly rollup table instead of scanning 50 million raw rows. We fix the base so you can work on better things. It is in pilots rather than generally available; if your schema is the part nobody dares to touch, see what we are building or book a call.
Sources
- Hybrid transactional/analytical processing, Wikipedia
- Oracle Database In-Memory: In-Memory Column Store introduction
- TiFlash overview, TiDB documentation
- About the AlloyDB columnar engine, Google Cloud documentation
- How the columnstore works, SingleStore documentation
- pg_duckdb: DuckDB-powered analytics in Postgres
- Unifying OLTP and OLAP: HTAP databases, zero-ETL, and best-of-breed architectures, ClickHouse
- Row-oriented vs column-oriented databases, ClickHouse
- What is HTAP?, PlanetScale
- Parallel query, PostgreSQL documentation
- Why DuckDB