TL;DR. pg_stat_statements keeps one statistics row per normalized query shape, 5,000 by default. When a workload mints new shapes faster than old ones repeat, the extension silently evicts its least-used entries: no error, no warning, just a counter in pg_stat_statements_info that almost nobody reads. ORMs have strained this design for years. AI-assisted coding tools and database agents break it, because they compose SQL fresh from schema context instead of replaying a fixed set of application queries. Postgres 18 fixed the easiest case, literal IN lists of varying length. The structural variety agents produce is untouched. The uncomfortable part is the loop: the automation that most needs query statistics to act safely is the workload erasing them.
pganalyze's deep-dive series on pg_stat_statements reached its sixth part in mid-August with the installment that reads like news rather than reference: diagnosing high-cardinality workloads. The mechanics it walks through have been in the extension for years. What has changed is the workload on the other side. The write-up names ORMs, dynamic SQL, and AI-assisted development tools as the generators that produce more unique queries than teams expect, and it lands on the operational consequence: if your workload consistently creates more distinct normalized queries than pg_stat_statements.max can hold, the extension cannot retain the metrics you tune with. That sentence deserves more weight than a part-six-of-six gets. Every index advisor, every slow-query review, and every database agent that reasons about your workload starts from the same fixed-size table, 5,000 rows by default, and AI-generated traffic is quietly aging that table out from under all of them.
One row per fingerprint, and agents mint fingerprints
pg_stat_statements works by normalizing each statement into a fingerprint, the queryid, and keeping one row of counters per fingerprint (per user and database). Constants are replaced with placeholders, so select * from orders where id = 7 and id = 42 share a row. Structure is not normalized. A different column list, a different join order, an added optional filter, a different alias pattern: each is a new queryid with its own row, starting its statistics from zero. The fingerprint is also computed over internal object identifiers rather than text, so the same query text run against two tenant schemas produces two entries.
That design is a good fit for the workload it grew up with: an application with a finite set of hand-written or ORM-generated queries, each executed millions of times. It is a poor fit for generators that produce structural variety, and the variety has been stacking up in layers:
| Generator | Why it mints new queryids |
|---|---|
| ORMs | Optional clauses, dynamic column lists, per-call ordering differences |
| Dynamic SQL | Application code assembling predicates per request |
| Per-tenant schemas | Same text, different object IDs, one entry per tenant |
| AI-assisted coding | Each generated data-access path is written fresh, not reused |
| Database agents | SQL composed from schema context per task, never repeated verbatim |
The last two rows are the new pressure. A human team, even one leaning on an ORM, converges on a stable query population because code is written once and executed many times. An agent writes the query at run time. pganalyze's series makes the point directly: AI-assisted tools query the database based on a schema, in whatever way they decide is best. Two agent runs that accomplish the same task can produce different SQL, and each variant occupies its own statistics row that will never accumulate enough repetition to matter.
Eviction is silent by design
Here is what happens when the table fills, straight from the extension's source. pg_stat_statements allocates a fixed hash table of pg_stat_statements.max entries, default 5,000, minimum 100. When a new query arrives and the table is full, the extension deallocates about 5 percent of existing entries, at least 10, chosen by lowest usage score. Usage rises with repeated execution and decays by a factor of 0.99 on each eviction cycle, so entries that stopped repeating drift toward the exit. The evicted rows are gone: their call counts, timing distributions, I/O counters, everything.
No log line marks this. The only tell is a counter, and it is worth checking today:
select dealloc, stats_reset from pg_stat_statements_info;
select count(*) as entries from pg_stat_statements;
show pg_stat_statements.max;
If dealloc grows between two reads a day apart, eviction is active, and the view you tune from is a survivorship sample. The entry count alone can mislead: a table pinned at max looks full and healthy while turning over hundreds of entries an hour.
Eviction is not the only cost. Query texts live in an external file with offsets held in shared memory, and when the file bloats past roughly twice its expected size, the extension garbage-collects it while holding an exclusive lock. pganalyze's write-up describes the worst-case profile an ORM-heavy, high-cardinality workload creates: many entries, each one large, the file at its maximum size, and frequent rewrites under that lock. Beyond the lost data, high cardinality turns the collection mechanism itself into a contention point on the system you are trying to observe.
The obvious response, raising pg_stat_statements.max, buys real headroom and is often the right first move. It is not free: more entries mean more shared memory, a larger text file, and slower reads of the view, and a generator that mints unbounded shapes will eventually fill any fixed table. A ceiling ten times higher is still a ceiling.
Postgres 18 fixed the easy half
The engine is not standing still, and the shape of its fix is instructive. Postgres 18 squashes constant IN lists when computing the queryid, so where id in (1, 2, 3) and a 200-element version now share one entry, displayed with a placeholder comment. The feature shipped after a revealing design debate: it was initially gated behind a GUC, query_id_squash_values, and the GUC was removed before release so the merged behavior is simply how Postgres 18 works. The community's judgment was that nobody benefits from keeping variable-length lists distinct.
Two limits matter. First, per an ongoing pgsql-hackers discussion, the squashing applies to constants in the parsed tree, not to parameters a driver binds. A JDBC-style in ($1, $2, $3) still produces one queryid per list length. The portable fix remains rewriting to an array parameter, which collapses every length into one shape on any version:
-- one queryid per list length when the driver binds each element
where id in ($1, $2, $3)

-- one queryid for any list length
where id = any($1::bigint[])
Second, squashing addresses value-count variety only. The variety AI generators produce is structural: different column lists, different join paths, different predicate combinations. No normalization pass can merge those without erasing the distinctions that make the statistics useful. The engine can keep sanding down specific cardinality sources, and each Postgres release will arrive after the workload that motivated it has already moved. Normalization is a fix for yesterday's generator.
The agent is on both sides of the ledger
What makes this more than an operations footnote is who consumes these statistics now. pg_stat_statements is the evidence base for nearly everything that reasons about a Postgres workload: index advisors, plan-regression detectors, the observability products being rebuilt around agents, and database agents themselves. Google's approach to agent-run databases gates agent actions on observability signals. Postgres 19's own automation-friendly surfaces, REPACK and plan advice, assume something upstream knows which queries matter, and that knowledge comes overwhelmingly from pg_stat_statements. When DBLifeBench measured how models handle operating a database rather than just writing SQL for it, the operating tasks were exactly the kind that begin with reading workload statistics.
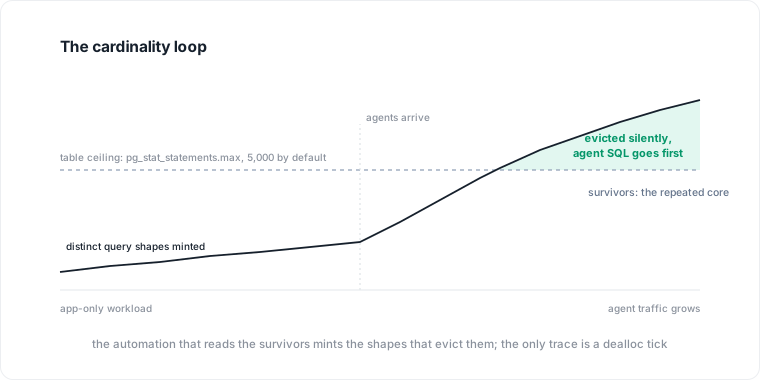
The loop: the automation that needs the statistics is the workload evicting them.
Now put the two halves together. Agent traffic mints unrepeatable query shapes. Those shapes flood the fixed-size table. Eviction removes the least-repeated entries, and in a mixed workload the agent-generated entries are the least-repeated almost by definition, but the churn also decays and evicts the long-tail application queries around them. The statistics table converges on describing the stable, boring core of the workload precisely as the novel, unreviewed, agent-generated part grows. The queries most likely to need scrutiny, because no human ever read them, are the ones least likely to have retained statistics. An agent asked to tune the database it is also querying reads an evidence base its own traffic has been erasing.
There is a second gap stacked on top: attribution. Even the entries that survive are keyed by user and query shape, and agent deployments today overwhelmingly share one database role, often the application's. A surviving row cannot tell you which agent produced it, whether one agent's retry loop or fifty agents' ordinary traffic filled it, or which task the query served. The engine's unit of accounting is the query shape. The unit you need to govern is the actor and the task, and nothing inside the engine carries it.
What holds up while the engine catches up
The practical ladder, roughly in order of effort. Measure the problem first: read dealloc weekly and treat sustained growth as data loss, not noise. Buy headroom second: raise pg_stat_statements.max knowing the costs above, and prefer array parameters over variable-length IN lists in code you control. Then constrain the generators you can constrain: agent frameworks that route data access through a fixed set of parameterized statements produce repeatable fingerprints, and the discipline pays off in every layer above. Tag what you cannot constrain: setting application_name per agent or per task at least partitions the traffic in logs and pg_stat_activity, even though pg_stat_statements will not break entries out by it.
None of this is a silver bullet, and it is worth being precise about why. Raising the ceiling defers the fill; it does not stop unbounded generators from eventually reaching it. Fixed statement sets trade away some of the flexibility that made agents useful in the first place, and teams will not always accept that trade. Tagging improves logs, not the statistics table. The residual fact is structural: an engine-resident, fixed-size, shape-keyed sample was designed for workloads that repeat, and the share of database traffic that repeats is falling.
That falling share is the actual story here. Query observability inside the engine assumed the workload was the stable object and the schema was the thing that changed. Agent traffic inverts this: the schema holds still while the workload becomes disposable. Whatever answers workload questions in that world has to live above any single engine's accounting, has to key evidence to actors and tasks rather than to text shapes, and has to treat "this query has no history" as the normal case rather than the exception.
Where Datapace fits
Datapace is building the context layer between your databases and your AI: resolved meaning validated by the people who own the data, the workload evidence beside it (cost, performance, usage and freshness, lineage), and a policy gate over what an agent may do and access, served over MCP. A statistics table that quietly forgets agent traffic is one instance of the general problem this piece describes: the evidence a safe agent needs does not live where the agent acts. If you are working out what agent-generated database traffic should look like in the first place, start with how agents get their own identities in Postgres, or book a call.
Sources
- pganalyze, "Diagnosing High Cardinality Workloads in pg_stat_statements", part 6 of the pg_stat_statements deep-dive series, August 2026.
- PostgreSQL source, contrib/pg_stat_statements/pg_stat_statements.c: eviction fraction, usage decay, dealloc counter, query-text file handling.
- PostgreSQL commit 9fbd53d, "Remove the query_id_squash_values GUC", 2025.
- pgsql-hackers, "queryId constant squashing does not support prepared statements", 2025.
- PostgreSQL documentation, F.32 pg_stat_statements.