TL;DR. S3 Standard has listed at $0.023 per GB-month in US East since December 1, 2016. Core database rates at AWS, Azure and Google show the same flat line. Over those years, cloud infrastructure revenue grew nearly 19 times, so the prices tracked here did not drive most of that growth. Real moves went both ways: Azure SQL Hyperscale storage rose 150% and DynamoDB on-demand fell 50%. TrendForce forecasts server memory up about 270% in 2026, while big-cloud storage list prices held. The last section gives a query that splits your own AWS bill into price and volume.
S3 Standard, Azure Blob Hot and Cloud SQL SSD storage all list today at their early 2017 rates. This post reads ten years of vendor price files, then compares S3 with Seagate's revenue per TB.
Prices are public US on-demand list rates at the first tier, read in November 2026. For most prices, we confirmed the first and last dates and assumed the years between.
Core list prices have barely moved since early 2017
S3 Standard last changed price in US East on December 1, 2016: the first tier fell 23%, from $0.030 to $0.023 per GB-month. The October 2026 price file still shows $0.023. That cut closed a fast stretch: one study puts S3 prices falling about 25% a year from 2014 to 2016. Count from January 2016 and S3 shows a 23% cut. Count from 2017 and it shows none, so the start date matters.
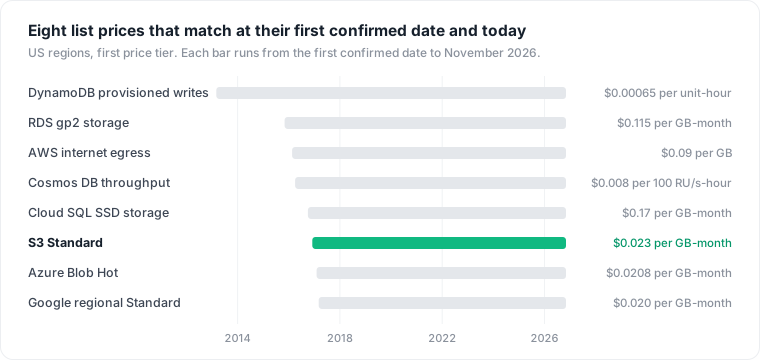
Adjusted for US inflation, $0.023 today is about 28% less than in December 2016, so a flat list price is still a real-terms fall. AWS also raised its free data transfer allowance from 1 GB per region to 100 GB a month in December 2021, while the $0.09 per GB rate stayed.
Database instance prices moved sideways. This is RDS PostgreSQL, Single-AZ, US East, 2 vCPU and 8 GiB, by generation:
| Instance class | On-demand price per hour |
|---|---|
| db.m4.large | $0.182 |
| db.m5.large | $0.178 |
| db.m6g.large | $0.159 |
| db.m7g.large | $0.168 |
| db.m8g.large | $0.168 |
| db.m9g.large | $0.183 |
The m4 and m5 classes are Intel, and the g classes are AWS Graviton. The Intel db.m6i.large in cloud database cost lists at $0.178, the same as db.m5.large. Newer chips likely do more work per dollar, but no independent benchmark covers the decade.
Storage did not fall per GB either: gp3 on RDS launched at the same $0.115 per GB-month as gp2, with a 3,000 IOPS baseline. For the full meter list, see RDS pricing.
Seagate's revenue per TB fell 62%, the S3 list price did not
Seagate's revenue per TB shipped is one stand-in for hard drive prices. It fell from about $41.0 in FY2017 to $15.5 in FY2026. S3 Standard's list price last changed in December 2016, five months into FY2017.
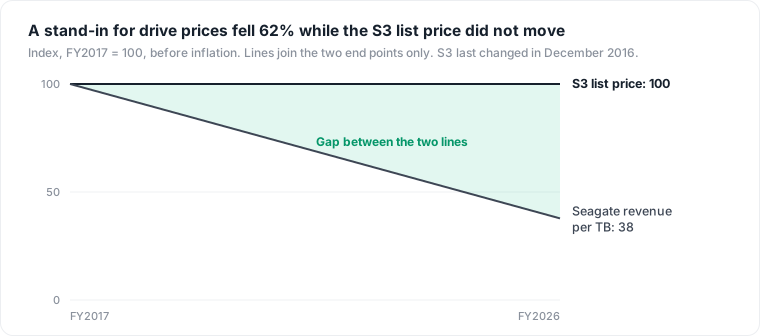
This gap does not measure profit. Seagate is one maker, the figure is total company revenue over exabytes shipped, flash is left out, and drives are one part of running a storage service. The fall has also stalled: revenue per TB ticked up in FY2026.
Provider margins are a weak test of whether hardware savings reached customers. AWS's operating margin rose from 25.4% in 2016 to 35.4% in 2025. Google Cloud's also rose, while Microsoft Cloud's gross margin is falling. Longer server lives helped AWS from 2020 to 2024, a 2025 change partly reversed that, and no filing isolates hardware savings.
Large price moves went both ways
Few of the prices tracked here moved much. A 50% cut undoes a 100% rise, so compare the two sides with care. We picked this list by hand, so it shows range and says nothing about frequency.
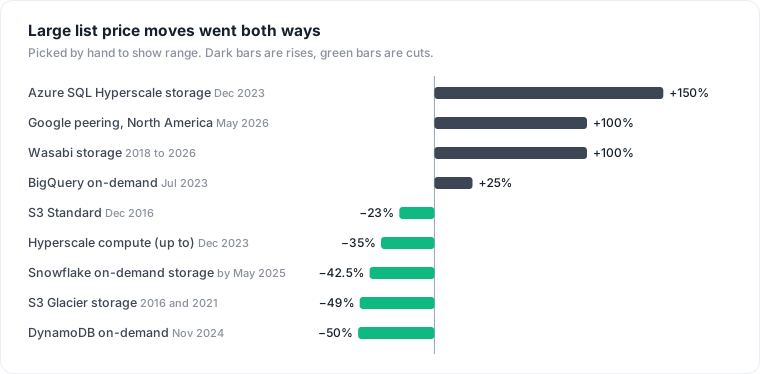
The cleanest cut came in November 2024, when DynamoDB on-demand throughput fell 50%, automatically and in all regions. Single-region provisioned rates still match 2013.
Other savings came from colder tiers, commitment discounts or new billing modes. Other new costs came through new fees, editions and products. RDS Extended Support is one: it bills automatically on engine versions past standard support and stops when you upgrade.
One change can do both. In December 2023 Microsoft cut Azure SQL Hyperscale compute prices and raised storage from about $0.10 to $0.25 per GB-month. In its examples, a 6 vCore, 50 GB database fell 35% and a 32 vCore, 18 TB one rose 3%. Older provisioned databases keep the old rates until December 14, 2026, and the share of customers on each side is not public.
Cloud revenue grew nearly 19 times, and the prices tracked here do not explain it
Synergy put cloud infrastructure services at almost $30B in the year to September 2016, and about $558B in the year to Q3 2026. The prices tracked here barely moved, so price rises did not drive most of that growth.
Public data cannot split it cleanly into usage, new customers, GPU rental and workloads moved off companies' own servers. Other measures grew less. Gartner's public cloud series grew about 9 times from 2016 to 2025, counting only lines that match across years. Its database market grew about 3 times from 2017 to 2024. We read both through secondary sources.
AI is a large part of the recent jump, but the evidence weakens as you move from total spend to storage and database bills.
| What AI may be driving | Our rating | Why |
|---|---|---|
| Total cloud spend | Strong | Synergy: AI-specific services are about a third of the market |
| GPU compute | Strong | IDC: servers took 97.6% of AI infrastructure hardware spend in Q1 2026, and storage 2.4% |
| Physical storage demand | Moderate | Hard drives sold out for 2026, though part of that may be delayed replacement |
| Customer storage bills | Weak | One vendor dataset shows storage's share rising alongside AI, with no tested link |
| Customer database spend | Weakest | We found no source that gives an AI share |
2026: memory forecast up 270%, big-cloud storage prices held
TrendForce forecasts server memory contract prices up about 270% in 2026 and enterprise SSD prices up about 235%. Smaller providers raised prices by 10% to 158%.
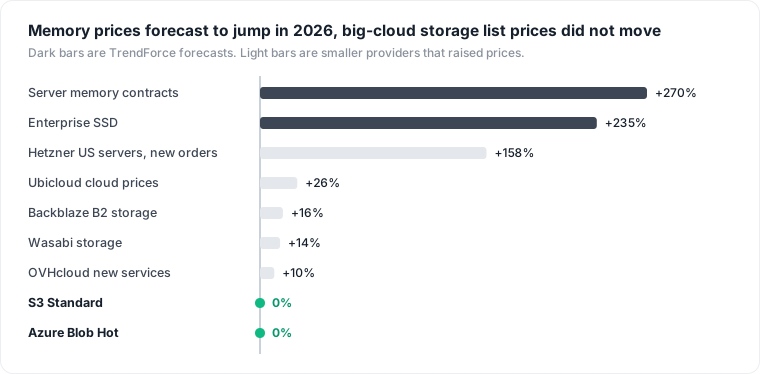
At smaller hosts most rises were on servers, but storage moved too. Backblaze and Wasabi raised storage prices directly. Hetzner reportedly raised object storage about 30% in April, and press reports put new US server orders up 158% in June. Ubicloud cited RAM costs, and OVHcloud left object storage out of its April round.
At AWS, Azure and Google, rises so far are narrow: reserved GPU capacity and Google peering. We found no rise on general AWS on-demand compute. Reports say Azure will raise VM and some storage prices in seven non-US regions from February 2027, with standard Block Blobs exempt. We could not confirm this from Microsoft's own notice.
How much of this reaches big-cloud list prices is unknown. Long-term supply deals may delay it, and high margins could absorb it. Watch reserved GPU capacity and non-US Azure regions first, since rises have started or been reported there.
Public data stops short of what you paid
Large commitment deals suggest many enterprises do not pay list price. Amazon's filings say pricing changes, mainly from long-term contracts, partly offset usage growth. The broad BLS hosting price index, which aims to use transaction prices, rose 27.5% from December 2016 to September 2026. Neither gives a paid price for cloud storage or databases.
So public data cannot settle whether the cloud costs more to run at enterprise scale. Staff, tooling and governance also sit outside the invoice, and we did not measure them.
How to split your own AWS bill into price and volume
Your own bill can answer what public data cannot. With the AWS Cost and Usage Report in Athena, this query is built to return usage and what you paid per usage type per month:
-- Not tested against a live CUR table. Adjust the table name.
SELECT date_trunc('month', line_item_usage_start_date) AS month,
       line_item_usage_type,
       line_item_operation,
       SUM(line_item_usage_amount) AS usage,
       SUM(CASE line_item_line_item_type
             WHEN 'Usage' THEN line_item_unblended_cost
             WHEN 'DiscountedUsage' THEN reservation_effective_cost
             WHEN 'SavingsPlanCoveredUsage'
               THEN savings_plan_savings_plan_effective_cost
           END) AS paid
FROM   your_cur_table
WHERE  line_item_line_item_type
       IN ('Usage', 'DiscountedUsage', 'SavingsPlanCoveredUsage')
GROUP  BY 1, 2, 3
ORDER  BY 2, 3, 1;
Legacy reports can omit columns you have never used. If Athena rejects a column, delete that branch of the CASE.
Divide paid by usage for an effective rate. A flat rate under rising cost for that usage type means volume did it. A rising rate means price, lost discounts, a lower volume tier or a change in mix did. Grouping by operation keeps engines apart, since one RDS usage type can hold several.
Reserved rows use the reservation effective cost and Savings Plans rows use the Savings Plans effective cost. A reserved row's unblended cost is zero, and a Savings Plans row's shows the on-demand charge. If your account has a discount, AWS adds net versions of these columns. Fees, unused commitments, credits and tax sit in other line types, so this total will not tie to the invoice.
What this analysis does not cover
These are list prices in US regions, and we assumed most years between the two end dates. The price moves are hand-picked, and Seagate stands in for a whole market. We did not check commercial engines such as SQL Server and Oracle, Multi-AZ pricing or non-US regions. We did not run the query against a live account.
Where Datapace fits
The query shows which usage type moved. The next question is which database, pipeline or team stands behind it. Datapace is building one map of your data estate with usage and cost attached, and agents that propose changes as pull requests your team reviews and merges. To see how one database bill compares across clouds at list price, read cloud database cost.
Sources
- AWS, Price List API: Amazon S3, Amazon RDS, October 2026 and Amazon RDS, November 2022, read November 2026.
- AWS, S3 and Glacier price reductions, November 2016, and free tier data transfer expansion, November 2021.
- AWS, DynamoDB price reduction, 2013 and DynamoDB on-demand and global tables, 2024.
- AWS, RDS gp3 storage and EC2 Capacity Blocks pricing.
- AWS, Cost and Usage Report: line item columns, reservation columns, Savings Plans columns, Reserved Instances and Savings Plans.
- Microsoft, Azure Retail Prices API, read November 2026, Azure SQL Hyperscale pricing and FY2027 Q1 earnings.
- Google Cloud, Cloud Storage price changes, 2017 storage pricing, archived, Cloud SQL pricing, archived, peering pricing and BigQuery editions.
- Amazon, 2017 10-K and 2025 10-K. Alphabet, Q3 2026 earnings release.
- Snowflake, pricing, December 2016 and credit consumption table.
- Wasabi, pricing, March 2018, archived and May 2026 pricing notice. Backblaze pricing update.
- heise on Hetzner, AgentDeals on Hetzner, Ubicloud price adjustment, OVHcloud repricing and Techzine on Azure.
- Byrne, Corrado and Sichel, The Rise of Cloud Computing, NBER.
- US Bureau of Labor Statistics, CPI-U and hosting price index via FRED.
- Seagate, FY2017 10-K and FY2026 10-K. Per TB ratios are derived.
- Synergy Research Group, 2016 review, 2025 results and Q3 2026 results.
- Gartner via TelecomTV and Merv Adrian.
- IDC on AI infrastructure spending, CloudZero Cloud Economics Pulse and The Register on hard drives.
- TrendForce, server memory and enterprise SSD forecast, August 2026.