Data cost map
What every part of your data costs.
Book a callDatabases, warehouses, pipelines and cloud services on one map, each with its cost, its usage and the project, team or client it serves. The bill stops being one number nobody owns.
What it does
Ask what you need.
- Sensor history$38.1k45% to gain
- Plant systems$7.2k
- Operational databases$82.3k28% to gain12% to gain
- Spreadsheets and files$454
- Export and backup jobs$3.0k10% to gain
- Landing and backups$36.7k57% to gain
- Loading and refresh jobs$82.3k35% to gain
- Lakehouse$48.7k26% to gain
- Index jobs$1.2k63% to gain
- Datasets built for a project$37.3k21% to gain
- AI services$39.7k34% to gain
- Assistant datasets$3.5k
Which tables does nobody read?
4 tables, $11.8k a month, nobody has read in six months or more.
- orders_archive_2019 · orders14 months$6.1k
- stock_snapshots_daily · stock9 months$2.4k
- orders_audit_old · orders7 months$1.8k
- crm_replica_2 · crm22 months$1.5k
Which open cases would cut it?
Two: database licences on idle cores, $64k a year, and replicas nobody reads, $18k.
Ask about this part
Questions teams ask
- Where do the costs come from?
- From your own systems: your cloud billing, or your on-premise budgets and licences. Datapace monitors them all the time.
- What happens after the map?
- It feeds the other two: cost reduction ranks its cases from it, and the budget forecast is built on it.
From the blog

Cloud waste in data infrastructure: energy and carbon cost
Companies estimate 29% of cloud spend is wasted. In data platforms it is idle warehouses, full scans, unread dashboards and GPUs waiting, all drawing power.
Read more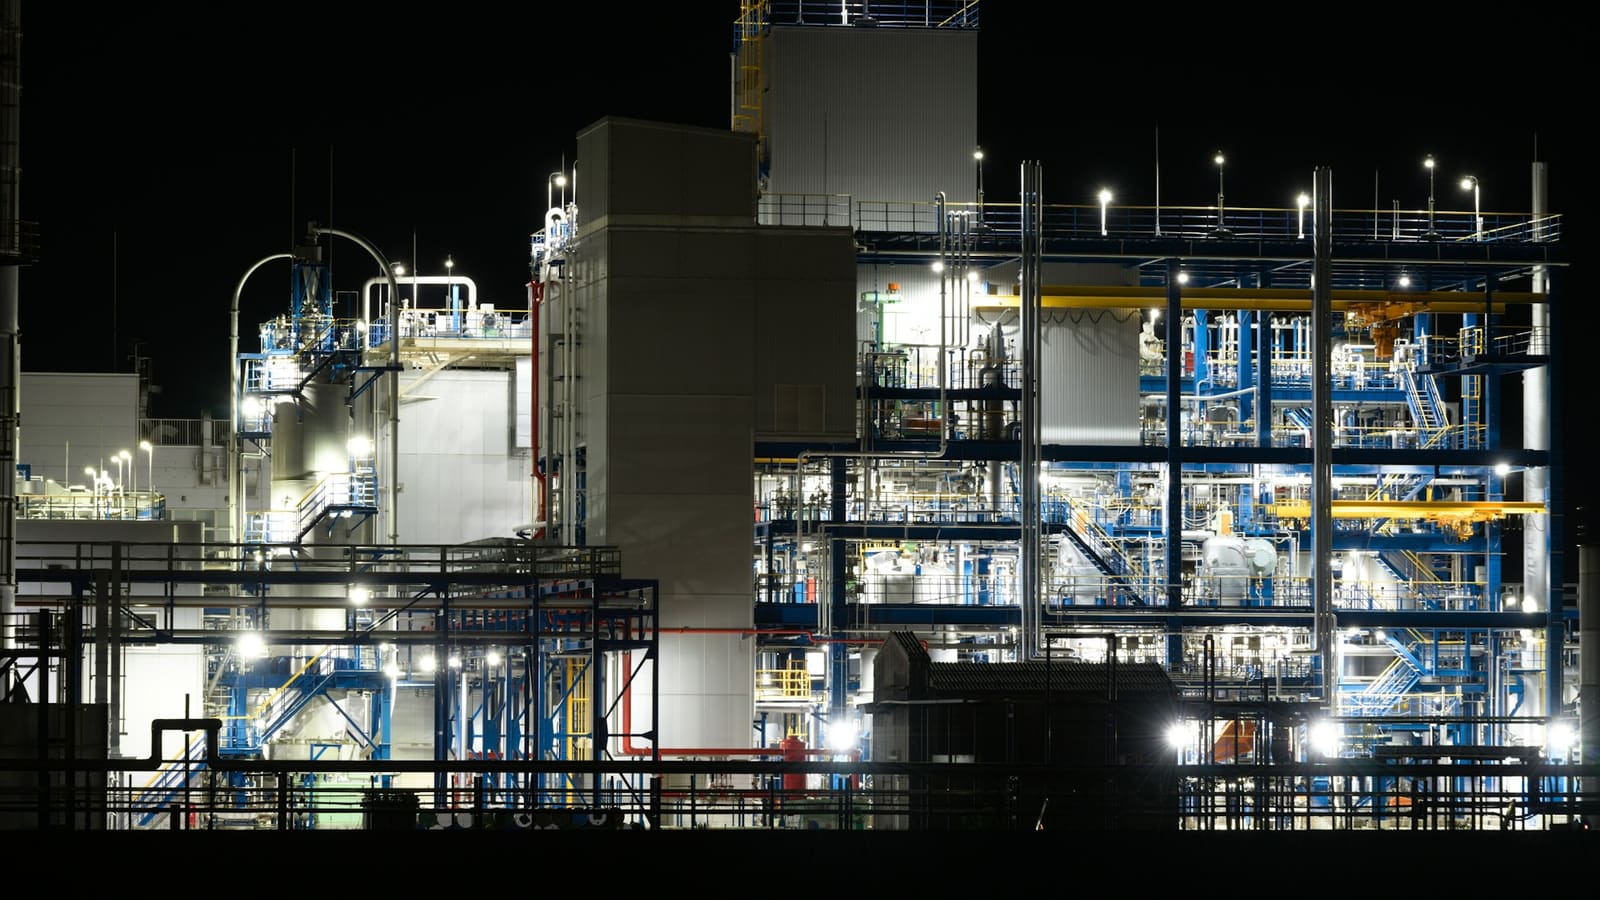
Industry 4.0 data explosion: the cost and complexity risk
Plants now log billions of readings a day. The cost risk sits less in the price of a gigabyte than in raw capture, small files, copies and integration work.
Read more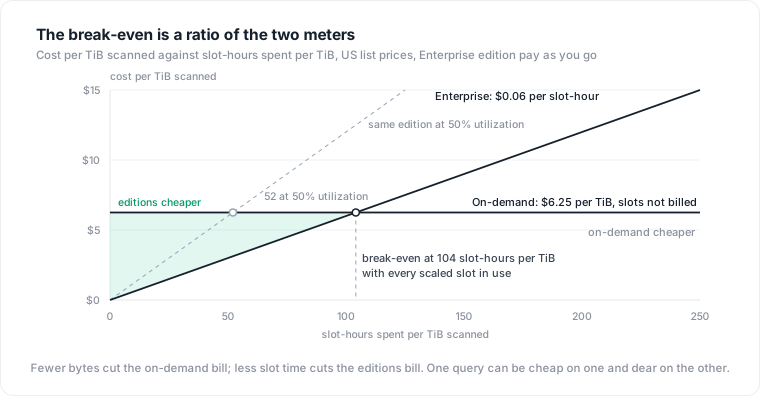
BigQuery on-demand vs editions: when slots cost less
BigQuery on-demand bills bytes scanned, editions bill slot-hours. The break-even is slot-hours per TiB, not monthly volume. How to compute it from job history.
Read more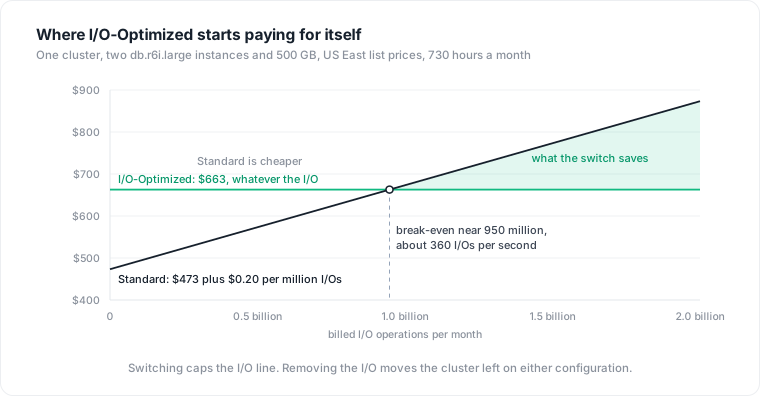
Aurora I/O-Optimized vs Standard: when the switch pays off
Aurora I/O-Optimized charges 30% more for compute and 2.25x for storage to make I/O free. The break-even formula, how to price I/O per query, and when to stay.
Read more
The other use cases
Ready to see your own estate on the map?
One call, your stack, and a first picture of what it holds and what it costs.