TL;DR. Industry 4.0 sites now count data in billions of readings a day, while a gigabyte of storage costs about two cents a month. The cost risk sits in what multiplies the bytes and the work: raw capture of high-rate signals, small files and per-message fees, copies across historian, lake and warehouse, data movement, and the engineers who integrate and clean it all. In a modelled plant, how vibration and power data are captured changed the storage bill about 420 times. The choice of storage tier changed it about 4 times. Surveys suggest less than half of industrial data is used effectively, though no independent measurement exists.
Shell's predictive maintenance program ingests 20 billion rows of data a week from more than 3 million sensors. Storing a gigabyte cost more than $500 in the early 2000s and as little as $0.02 by 2020. Put those two facts side by side and the "data explosion" looks harmless. It is not, and the research on Industry 4.0 data management explains why: the cost of industrial data depends more on how it is captured, copied, moved and integrated than on its volume. This article puts numbers on each of those multipliers, using published prices, vendor documentation and peer-reviewed reviews, and is explicit about where the evidence stops.
Industrial sites now count data in billions of readings a day
The best-sourced volume figures are counts that companies state about their own sites. Intel said in 2017 that it processes more than five billion data points per day per factory. Kioxia's Yokkaichi memory plant collects more than 3 billion data every day from several thousand process, inspection and measurement tools. Brisa's Aksaray tire plant reported over 800 million data per day from its machinery and vehicles when it opened in 2018. Shell's program covers more than 10,000 pieces of equipment and runs nearly 11,000 machine learning models.
Byte totals are rarer and softer. Cisco estimated in 2015 that a typical offshore oil platform generates 1 to 2 TB of data a day, and that moving one day of it to a central repository over satellite would take about 12 days. The fibre-optic well monitoring on Equinor's Johan Sverdrup field was reported to produce up to 500 TB a week. BMW's cloud data hub processes 10 TB a day from 1.2 million vehicles. These are company statements and estimates, not audited measurements, and they cover very different scopes.
The number of sources keeps rising. IoT Analytics counted 21.1 billion connected IoT devices at the end of 2025, 45% of them enterprise connections, and expects 39 billion by 2030. Spending follows: in Deloitte's 2025 survey of 600 large US manufacturers, 40% ranked data analytics their first or second investment priority for the next two years, ahead of cloud and AI.
A gigabyte got cheap, and the bills still surprise people
The academic work is clear that storage cost is a direct consequence of monitoring more of the plant. A 2020 paper in Computers in Industry by Villalobos and colleagues states that growing monitoring of industrial systems creates considerable storage costs, and proposes a three-level architecture to cut them: raw time series on SSD for a short period, recent series on hard disks for a medium period, and only a reduced representation of the series kept for the long term. The design choice is to throw detail away on purpose as data ages.
McKinsey's guide to industrial IoT, which argues firmly for moving manufacturing to the cloud, still lists the costs that break the business case: running cloud and on-premises systems in parallel during migration, hidden costs when platforms and services are not actively managed, integrator fees that run into the third or fourth year, and add-on services that can cost three to four times more than needed when applications are poorly configured. In a footnote to one exhibit it adds that databases are frequently underestimated and can cost up to 10 times more in the cloud, and that even successful cases often break even only in year three or four. The 10x figure comes with no method or sample, so read it as a warning, not a benchmark.
McKinsey's 2021 IoT report adds the scaling side: 70% of manufacturers had not scaled beyond pilots, and costs were often higher than estimated in pilots, mainly for installing sensors at scale and integrating them with legacy systems. A 2025 systematic review of industrial data management by Freitas, Rocha and Barata, covering 76 papers drawn from 11,626 search hits, found no consistent data management methodology, even within one type of company.
So the cheap gigabyte hides at least six multipliers. Five act on the bytes and what each byte costs. The sixth is the work around them.
One plant, two capture designs: a 420x difference
To see where the bytes come from, take an illustrative mid-size plant. The inputs are sourced; the plant is invented.
- 10,000 process tags (temperature, pressure, flow, level) scanned at 1 Hz, the scan rate in AVEVA's own PI System example. A reading is 16 bytes raw (an 8-byte value and an 8-byte timestamp). Time-series codecs bring that to about 2.2 bytes per point for regular data, and Facebook's Gorilla engine reached 1.37 bytes on monitoring data.
- 200 vibration sensors, triaxial, 16-bit, sampling at 25.6 kHz, the top rate of a current industrial wireless sensor.
- 50 power quality meters with 30 parameters each. IEC 61000-4-30 Class A measures on a basic interval of about 200 ms and aggregates to 10 minutes.
A year has 31.5 million seconds, so the process tags alone produce 315 billion points: 5.05 TB raw, or about 0.7 TB compressed. A vibration sensor streaming continuously writes 153.6 KB a second, which is 4.8 TB a year per sensor and 969 TB for the fleet. The same sensors capturing a one-second burst every 10 minutes write 1.6 TB a year in total, 600 times less. Power quality is similar: every 200 ms it is 946 GB a year for the 50 meters, and as 10-minute aggregates it is a third of a gigabyte.
Combine the sensible choices (compressed tags, vibration bursts, 10-minute power quality) and the plant writes about 2.3 TB a year. Combine the raw ones and it writes about 975 TB. After ten years, priced at AWS's published S3 rates in us-east-1, that is the difference between a storage bill of $127 to $531 a month and one of about $54,000 to $224,000.
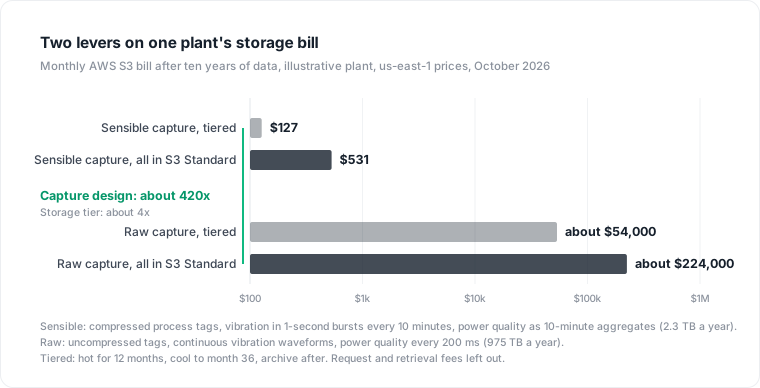
Moving old data to cheaper tiers (hot for a year, cool to month 36, archive after) cuts the bill by about 55% to 62% on all three clouds. That is worth doing. It is also a factor of about 4, against a factor of about 420 decided at the sensor. The most expensive storage decision in this plant is made when someone configures a vibration sensor to stream, usually long before anyone prices it.
This arithmetic leaves out request and retrieval fees, ingest services, copies and people, which the rest of this article covers. It also assumes one copy of the data. Real estates hold several.
Where the multipliers hide
Raw capture and resolution
Historians were built to avoid storing what does not change. AVEVA's own example shows a status tag scanned every second for 48 hours: 172,800 events without compression, 15 with minimal compression. At a US downstream oil and gas customer, modest exception and compression settings on 14 high-frequency tags cut stored events by 0.2% to 95%, and half the tags met or beat the 3:1 compression ratio AVEVA suggests as a minimum. Before the study, many tags had been set to little or no compression, and users complained about slow queries and long backfills.
The same logic applies to resolution. A 2025 preprint on oil well test data found the sampling rate could be cut by up to 80% while keeping relative error below 2%. That is one study on two wells, but it is the kind of measurement most plants never run before deciding to keep everything at full rate.
Small files and per-message fees
Cloud object storage punishes small objects. S3 Standard-Infrequent Access and Glacier Instant Retrieval bill a minimum of 128 KB per object, and Deep Archive adds 40 KB of metadata to each one. Stored as 1 KB objects, a terabyte of sensor readings costs $23 a month in S3 Standard and $1,600 a month in Standard-Infrequent Access, 70 times more. Moving that terabyte to Deep Archive costs $50,000 in lifecycle transition requests to save about $22 a month.
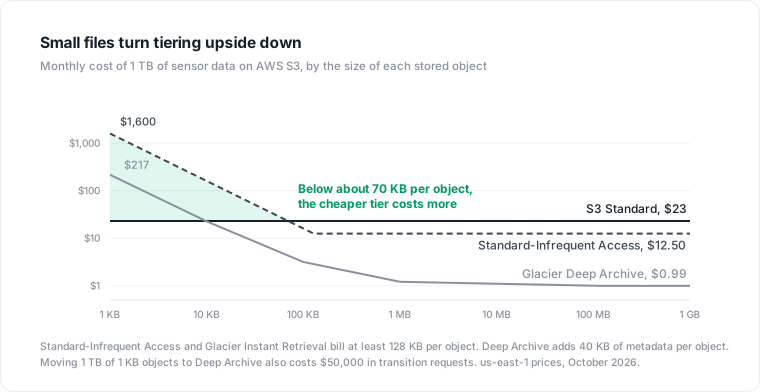
Ingest services price by message. AWS IoT Core charges $1.00 per million messages, metered in 5 KB increments, so a 24-byte reading costs as much as a 5 KB batch. Sending the plant's 10,000 tags one point per message would cost about $229,000 a year on IoT Core. Batching 100 points per message brings it to about $3,200. Nothing about the plant changed, only how the data was packed.
The fix is boring and effective: batch sensor data into files of tens of megabytes, preferably columnar, before any lifecycle rule or ingest meter touches it. Columnar formats also cut query cost. AWS's own Athena example shows a query on a Parquet copy reading one column of four costing $1.25 against $15 on raw text.
Storage tiers with exit fees
Archive tiers are 17 to 23 times cheaper than hot storage: $0.023 against $0.00099 per GB-month on AWS, $0.0208 against $0.00099 on Azure, and $0.020 against $0.0012 on Google Cloud in us-east regions, read in October 2026. The first step down saves much less, 1.4 to 2 times. The cheap tiers also come with minimum storage durations of 180 days (AWS Deep Archive, Azure Archive) to 365 days (Google Archive), and retrieval fees of 20 to 42 times their monthly price per GB.
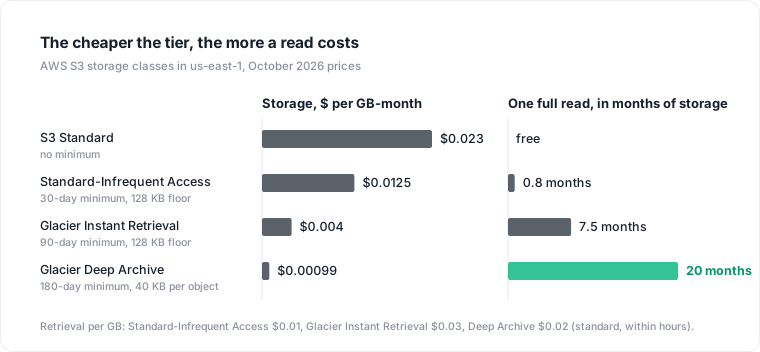
So one full read-back of a Deep Archive copy costs about 20 months of keeping it there. That is fine for compliance data nobody will read and painful for the training set a data science team rediscovers next year. Tiering decisions need the read pattern, which is exactly what a sensor data lake rarely records.
The database layer is pricier still. Amazon Timestream for InfluxDB charges $0.10 to $1.00 per GB-month for its block storage, against $0.023 for its object storage tier, 4 to 43 times more. Ten years of the sensible plant's data, 23 TB, would cost $2,300 to $23,000 a month there, against $531 in S3 Standard.
Copies of the same signal
A single temperature reading can live in the historian, an operational database, the raw zone of a lake, a curated zone, a warehouse table and a feature store. Nobody has published a measured count of these copies for industrial data. The anchors are indirect: IDC estimated in 2020 that the world held about nine replicated bytes for every unique one, and in Dun & Bradstreet's 2025 manufacturing survey, 54% of respondents struggled with duplicate data sitting in several systems, and 51% said their data was siloed in disparate tools.
Each copy can carry its own multiplier. Snowflake's documentation describes a 200 GB table updated 20 times a day that ends up billed as about 32 TB, because every changed version is kept for Time Travel and then for seven days of Fail-safe. Created as a transient table and backed up daily, the same table totals about 2 TB. dbt's own guidance is to materialize staging models as views, to avoid wasting warehouse space on models nobody queries.
Copies also cost work. The 2023 systematic review of data quality in industrial IoT by Goknil and colleagues notes that systems pulling from many sources stack several storage layers, and each layer needs its own cleaning. Swapping one storage component can force changes to the cleaning that depends on it.
Data movement
Moving data out of a cloud costs $0.05 to $0.12 per GB to the internet and $0.01 to $0.02 per GB between regions on all three major clouds. Taking 100 TiB out once costs about $7,900 to $11,400. Inside one region, transfers between availability zones add up quietly: in Datadog's 2024 analysis of AWS bills, 98% of organizations paid cross-zone charges, which made up about half of their data transfer cost.
The industrial version of this problem starts before the cloud. Freitas and colleagues note that sending everything to the cloud needs high bandwidth and raises monetary cost, while keeping it local means paying for all the hardware, and that every paper in their review combining heterogeneous data, real time and the cloud relied on preprocessing first. Raptis and colleagues, in a 2019 review of data management in Industry 4.0, propose keeping recent data at the plant and older data in the cloud, and warn that relying only on global clouds costs manufacturers control over their data.
Integration and people
Most of the money in industrial data goes to people. In a 2021 survey of 300 data leaders commissioned by Fivetran, data engineers spent 44% of their time building and rebuilding pipelines, about $520,000 a year for a median team of 12. A 2022 survey for Monte Carlo found data teams spending 40% of their time checking data quality. Both surveys cover all industries and were paid for by vendors who sell the fix, but they point the same way. In an Enterprise Strategy Group survey of 403 North American data professionals, 95% of manufacturers reported difficulty with data management and analytics initiatives, and 42% planned to hire more staff for data integration, against 34% in other sectors.
Industrial integration is hard for structural reasons. The ISA-95 model, used in OPC UA's companion specifications, stacks five levels from the physical process through sensors, PLC and DCS control, SCADA and historians, up to ERP. Kirmse and colleagues found that on the shop floor the number of data sources rises sharply, naming is inconsistent, and the meaning of a data point often lives only in its tag name or address, so extracting it takes an expert. McKinsey describes one manufacturer setting out to rationalize more than 30 ERP systems inherited through acquisitions.
Mourtzis and colleagues treat this as complexity in its own right: in a 2019 robotics case study they propose information theory metrics for the communication among a line's integrated systems, and compare the line before and after its move to Industry 4.0. In that view, complexity is a property of the connections as much as of the bytes. For small and mid-size firms the constraint bites hardest; a 2025 review by Abreu and Leite calls for low-cost governance and scalable integration sized for SMEs.
Most industrial data looks unused, but the evidence is thin
The most quoted figure, that 68% of enterprise data goes unused, comes from a 2020 survey of 1,500 enterprise leaders that Seagate commissioned from IDC. The press release gives no method and does not mention manufacturing. Splunk's 2019 survey of more than 1,300 leaders put dark data at 55%, with manufacturing 12% of respondents. The newest industrial number is Rockwell's 2026 State of Smart Manufacturing, where 1,560 respondents in 17 countries said only 43% of collected data is used effectively.
All three are perceptions, not audits of storage or access logs. The academic picture is thinner still. Goknil and colleagues report a figure of almost 90% of IoT data being dark, citing another paper, and found that only 6 of the 51 data quality studies they reviewed had been evaluated in a real industrial setting. A 2021 review by Gimpel found that only 3 of 1,202 research articles addressed dark data from IoT.
The direction is consistent across sources, and the risk follows from it: paying to capture, copy, move and keep data whose use nobody can name. Data lakes are where this goes wrong at scale. Gartner warned in 2014 that ingesting disparate data without metadata and governance turns a lake into a data swamp whose meaning, quality and origin are unknown, and the 2025 industrial review repeats the warning for lakes and lakehouses.
Interoperability decides how much of the value is reachable
The upside is real, which is why the cost matters. McKinsey estimates that factories hold about a quarter of the potential economic value of IoT in 2030, and that 25% to 74% of the total value it models depends on systems being able to work together. A steel plant case published by Bousdekis and Mentzas in 2021 shows what a working integration can deliver at one cold-rolling station: failures fell from 96 to 65, planned maintenance time from 2,340 to 1,440 minutes, and OEE rose from 59.4% to 64.5%, in a single before-and-after comparison.
The same paper lists what it took: interfaces and data formats defined early, a plan to uplift legacy data when direct integration failed, and domain experts working with analysts. Freitas and colleagues reach a similar conclusion across 76 papers: each industry has its own protocols, extraction is mostly custom, and they recommend reference architectures such as RAMI 4.0 and IIRA to make integration repeatable.
What the companies that cut the bill changed
The best-documented cases of cutting data cost by changing what is kept come from automotive cloud storage, not plant historians. BMW, working with AWS on petabyte-scale autonomous driving data, found and deleted unused cache data, nearly 30% of one account's S3 data and cost, turned on Intelligent-Tiering, disabled versioning so deletions freed space, and converted raw access logs to Parquet. Toyota Connected North America saved more than 40% a month on connected-vehicle storage despite 4% more data, mostly by matching tiers to access patterns. Rivian cut 30% on driver-assistance data and 70% on engineering files with access-based tiering.
No published case from mining, oil and gas, metals or chemicals reports a measured saving from changing retention, sampling or resolution. That gap is itself a finding: the decisions that set most of the bill are rarely measured before or after.
A checklist before the next sensor goes live
- Set resolution per signal. Decide burst or continuous capture for vibration, aggregation intervals for power quality, and historian exception and compression settings. AVEVA's defaults are not zero, and at one refinery many tags had been set to little or none.
- Batch before you tier or meter. Write files of tens of megabytes in a columnar format. Never one reading per object or per message.
- Tier by read pattern. Archive only what nobody expects to read, and check minimum durations and retrieval fees before the rule runs.
- Count the copies. Give each copy of a signal an owner and a consumer. Build staging layers as views, and use transient tables for high-churn landing data.
- Price movement. Keep processing next to the data, and watch cross-zone and egress lines on the bill.
- Put a cost and a consumer next to every dataset. Data with neither is the first candidate for deletion, as BMW found.
None of this requires keeping less information. It requires deciding, signal by signal, how much detail is worth paying for, and checking that decision against what is actually read.
What the research does not show
The sources support the existence of these costs, not their size in a typical company. None of them establishes that every Industry 4.0 company overspends, or that data volume alone makes costs grow faster than value. The plant above is an illustration built from published prices and specifications, and a real estate will differ in every input. The unused-data figures are survey perceptions. The labour figures come from vendor-commissioned surveys across all industries. What is missing is plant-level measurement: how many copies of a signal exist, what each costs, and who reads them.
Where Datapace fits
The multipliers in this article survive because nobody sees the whole chain at once: which historian tags feed which lake tables, which warehouse models and dashboards read them, what each step costs, and which copies nobody reads. Datapace is building that view: one map of the data estate, from plant systems and historians to cloud warehouses and the projects and AI that use them, with usage and cost attached to each part. Agents work from the map and propose changes, such as a retention rule for a raw landing zone, batching a small-file pipeline or dropping a copy with no consumer, as pull requests your team reviews and merges. Cost is where it starts, and the same map serves performance work, migrations and AI on the data. To see what the map would show on your estate, look at the data cost map or book a call.
Sources
- Villalobos, Ramirez-Duran, Diez, Blanco, Goñi and Illarramendi, A three level hierarchical architecture for an efficient storage of Industry 4.0 data, Computers in Industry 121, 2020. Abstract read; the full text is closed access.
- Freitas, Rocha and Barata, Data management in industry: concepts, systematic review and future directions, Journal of Intelligent Manufacturing, published online February 2025.
- Mourtzis, Fotia, Boli and Vlachou, Modelling and quantification of Industry 4.0 manufacturing complexity based on information theory: a robotics case study, International Journal of Production Research 57(22), 2019. Abstract read.
- Abreu and Leite, An Overview of the Opportunities and Challenges of Data Analytics in Industry 4.0: Solutions for a Data-Driven Future in SMEs, Procedia Computer Science 263, 2025. Abstract read.
- Behrendt, de Boer, Kasah, Koerber, Mohr and Richter, McKinsey, Leveraging Industrial IoT and advanced technologies for digital transformation, about 2021 (storage price p. 12; cloud and database costs pp. 60 and 61).
- Goknil et al., A Systematic Review of Data Quality in CPS and IoT for Industry 4.0, ACM Computing Surveys 55(14s), 2023.
- Chui, Collins and Patel, McKinsey, The Internet of Things: Catching up to an accelerating opportunity, November 2021.
- Hai, Koutras, Quix and Jarke, Data Lakes: A Survey of Functions and Systems, arXiv, 2023 (Gartner's 2014 data swamp warning).
- Kirmse et al., Industrial Big Data: From Data to Information to Actions, IoTBDS 2019.
- Raptis, Passarella and Conti, Data Management in Industry 4.0: State of the Art and Open Challenges, IEEE Access 7, 2019.
- Bousdekis and Mentzas, Enterprise Integration and Interoperability for Big Data-Driven Processes in the Frame of Industry 4.0, Frontiers in Big Data, 2021.
- Gimpel, Dark data: the invisible resource that can drive performance now, Journal of Business Strategy 42(4), 2021.
- OPC Foundation, OPC 10030, section 4.2.3 (ISA-95 levels).
- C3 AI, Shell achieves major milestone, scales AI predictive maintenance to 10,000 pieces of equipment, March 2022.
- RCR Wireless, Inside Intel's digital transformation of manufacturing processes, November 2017.
- Kioxia, Yokkaichi plant smart factory.
- European Rubber Journal, Brisa starts smart tire factory in central Turkey, December 2018.
- Cisco, Digital transformation in the oil and gas industry: drill data drill, June 2015.
- GeoExpro, article on fibre-optic monitoring at Johan Sverdrup, April 2022.
- AWS, BMW Group case study.
- IoT Analytics, State of enterprise IoT, February 2026, and Number of connected IoT devices, October 2025. Analyst estimates, revised between editions.
- Deloitte, 2025 Smart Manufacturing and Operations Survey, May 2025.
- AVEVA (Bregenzer), Exception, Compression, and their Impacts on PI System Performance, AVEVA World San Francisco, 2023.
- Pelkonen et al., Gorilla: A Fast, Scalable, In-Memory Time Series Database, VLDB 2015, and InfluxData, InfluxDB 0.10 announcement (2.2 bytes per point).
- Advanced Technology Services, 1-Channel Vibration Sensor Plus spec sheet, 2025.
- Fluke, What does the IEC 61000-4-30 Class A standard mean to me?
- Soto Marcos, preprint on reducing the sampling rate of oil well test data, arXiv, February 2025. Single case study.
- AWS, S3 pricing, S3 storage classes and the S3 price list for us-east-1, read October 2026.
- Microsoft, Azure Blob Storage pricing (East US, LRS, read through the Azure Retail Prices API) and Access tiers for blob data, read October 2026.
- Google Cloud, Cloud Storage pricing (us-east1) and Storage classes, read October 2026.
- AWS, IoT Core pricing, Timestream price list, data transfer price list and Athena pricing, read October 2026.
- Datadog, State of Cloud Costs 2024. Vendor telemetry, AWS only.
- Snowflake, Storage considerations for tables, and dbt Labs, How we structure our dbt projects: staging.
- IT-Online, report on IDC's Global DataSphere, May 2020 (ratio of unique to replicated data). Secondary source.
- Dun & Bradstreet, Manufacturing data quality and the AI failure gap, 2025. Vendor survey.
- Fivetran, State of Data Management, November 2021 (n=300). Vendor-commissioned.
- TDWI, Data Engineers and Bad Data Survey, August 2022, reporting Monte Carlo's survey (n=300). Vendor-commissioned.
- IIoT World, The state of DataOps in manufacturing in 11 stats, August 2023, reporting an Enterprise Strategy Group survey (n=403).
- Seagate, Rethink Data press release, July 2020. Vendor-commissioned survey.
- Splunk, The State of Dark Data, 2019. Vendor survey.
- Rockwell Automation, 2026 State of Smart Manufacturing release, May 2026 (wire copy).
- AWS, BMW autonomous driving storage optimization, November 2025; Toyota Connected North America, May 2024; Rivian, April 2024. Vendor blogs written with the customers.