Photo: Charlie Mitchell on Unsplash
TL;DR. Cloud waste is an energy problem as much as a budget one. Buyers estimate that 29% of their cloud spend is wasted, measured Kubernetes clusters average 8% CPU use, and an idle server still draws a quarter to a third of its peak power. In a data platform the waste sits in warehouses and clusters that never suspend, queries that scan the whole lake, pipelines that rebuild unchanged tables, dashboards refreshing for nobody, GPUs waiting for work, data nobody reads, and databases nobody connects to. Removing it cuts cost and carbon together. Region choice, fees and discounts are where the two part ways, so measure kilowatt-hours and CO2e next to dollars.
Data centers used about 485 TWh of electricity in 2025, and the IEA expects that to roughly double by 2030. A large share of the cloud capacity behind that number does no useful work. Cloud waste usually gets treated as a finance problem, but idle and oversized infrastructure also keeps drawing power, keeps hardware reserved and keeps emitting carbon, on grids that are already short of capacity. This article follows a wasted dollar from the bill to the grid, then goes layer by layer through where it hides in a data platform: lakehouses and warehouses, pipelines, dashboards, the AI on top, lake storage and the databases underneath.
Data centers are heading for 3% of the world's electricity
The IEA estimates that data centers used about 415 TWh in 2024, around 1.5% of the world's electricity, and 485 TWh in 2025. That is a 17% jump in one year, against about 3% growth in global electricity demand, and consumption by AI-focused data centers grew 50%. The agency expects the total to roughly double to 950 TWh by 2030, about 3% of global demand. The United States used 45% of the 2024 total, China 25% and Europe 15%.
Three percent sounds small. Locally, it is not. Data centers used 23% of Ireland's metered electricity in 2025, more than all urban homes combined. Berkeley Lab estimates that US data centers used 192 TWh in 2024, or 4.7% of the country's electricity, and projects 11.8% by 2030 in its reference case. In PJM, the grid that serves Northern Virginia, the independent market monitor attributes $29.4 billion of capacity charges over the last four auctions, 46.2% of the total, to data center load, and the latest auction fell 6,831 MW short of the reliability requirement. Under current policies, EPRI expects natural gas to supply most of the new generation built for US data centers.
The operators' own reports show the same curve. Google's data centers used 42.4 TWh in 2025, up 38%, and its ambition-based emissions rose 18% in a year to 14.5 million tonnes of CO2e, 81% above 2019. Microsoft's electricity use went from 10.8 TWh in fiscal 2020 to 37.0 TWh in fiscal 2025. Amazon's footprint rose 16% to 80.85 million tonnes in 2025, with emissions from purchased electricity up 34%.
The buildings are already efficient. Google reports a fleet PUE (power usage effectiveness: total facility energy divided by the energy that reaches the IT equipment) of 1.09, Amazon 1.14 and Microsoft 1.17, against an industry average of 1.52 in the Uptime Institute's 2026 survey. The same survey found that only 37% of operators collect server utilization data at all, against 79% who track PUE. The industry measures how efficiently it cools its servers far more closely than whether those servers do anything.
Companies admit to 29% waste, and the meters show more
Ask cloud buyers how much of their spend is wasted and the answer barely moves from year to year. In Flexera's 2026 State of the Cloud survey of 753 technical professionals and executives, respondents estimated that 29% of their IaaS and PaaS spend was wasted. That is up from 27% the year before, the first rise after five years of decline, and Flexera ties it to the cost complexity of AI and new services. Cost (85%) outranked security (82%) as the top cloud challenge for the fourth year running.
Set that share against the size of the market and the waste is large. Gartner's last public forecast with a full split put 2025 spending on IaaS at $211.9 billion and PaaS at $208.6 billion, out of $723.4 billion for public cloud in total. Applying a survey estimate to a market forecast is rough arithmetic, but 29% of those two lines comes to about $122 billion a year. Harness ran a narrower version of the same sum: 21% of 2025 IaaS spend, or $44.5 billion in potential savings on underused resources. Spending keeps climbing either way. Gartner now expects IaaS alone to reach $292 billion in 2026, up 31.3%.
Survey answers are a floor. When tools measure what actually runs, the picture gets worse. CAST AI's 2026 report, built from tens of thousands of Kubernetes clusters on AWS, Google Cloud and Azure before any optimization, found average CPU utilization of 8% in 2025, with memory at 20% and GPUs at 5%. Datadog's 2024 analysis of AWS bills found 83% of container costs tied to idle resources: 54 points from clusters bigger than their workloads, 29 points from workloads asking for more than they use. These denominators differ from Flexera's, so the numbers do not compare one to one, and both samples come from customers of cost tools, who may have had reason to look. They still point the same way: most rented capacity does nothing most of the time.
Practitioners know it. "Workload optimization and waste reduction" was the top current priority in the FinOps Foundation's State of FinOps surveys for both 2025 and 2026, and the share of practitioners managing AI spend went from 31% to 98% in two years. Carbon barely registers in that work: in 2025, only 3% of FinOps practices made optimizations based on carbon.
An idle server still draws a quarter to a third of its peak power
Waste would be harmless for the climate if idle hardware drew no power. It does. In Google's classic study of more than 5,000 servers, machines spent most of their time between 10% and 50% utilization, and even an efficient server consumed about half its full power while doing almost no work. Hardware has improved since 2007, though less than you would hope. Across 16 years of SPECpower results, a benchmark where vendors tune servers for efficiency, idle draw fell from 70.1% of full-load power in the earliest runs to a low of 15.7% in 2017, then rose back to 25.7% in 2024. Lawrence Berkeley National Laboratory's model of the real US fleet assumes conventional servers idled at 36% of their maximum power in 2023, and AI servers at about 20%.
Utilization is where cloud and on-premises split. The same LBNL report models servers in internal and small data centers at 11% utilization in 2014, rising to 20% by 2027, against 45% to 50% in hyperscale facilities. Hyperscalers pack their own fleets well, and their customers then leave most of what they rent idle inside them, as the 8% CPU figure shows. How much of that idle rented capacity turns into idle host power depends on how providers overcommit and consolidate machines, which they do not publish.
The arithmetic of a mostly idle machine is unkind. LBNL models a server's average power as a straight line between its idle and maximum draw. With a 36% idle floor, a server running at 10% utilization draws about 42% of its peak power while doing a tenth of its possible work. Each unit of work costs about four times the energy it would at full load, and about 85% of what the machine draws is the idle floor. (That is our arithmetic on LBNL's model, not a measurement.)
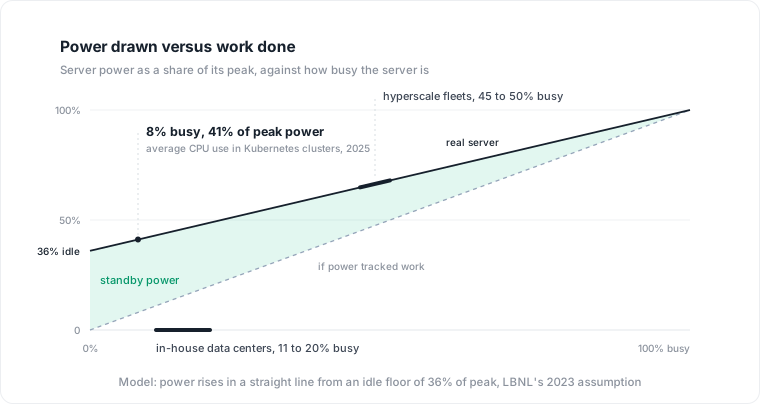
Most servers sit at the left of this chart, where the idle floor is most of the power drawn. Idle floor and utilization by data center type from LBNL's 2024 report; Kubernetes CPU from CAST AI's 2026 report.
Some machines never do any work at all. The last large study of comatose servers, by Jonathan Koomey and Jon Taylor in 2017 on 2015 data, found that about a quarter of physical servers and 30% of virtual machines had done no useful computing for six months or more, in companies that had not cleaned up. Nobody has repeated a study of that size since.
How a wasted dollar becomes kilowatt-hours and carbon
A cloud bill has no electricity meter on it, so every estimate is a chain of assumptions. The open-source Cloud Carbon Footprint model, still maintained and last released in April 2026, makes the chain explicit: usage, times an energy coefficient, times the provider's PUE, times the carbon intensity of the local grid, plus a share of the emissions from manufacturing the hardware. For compute, it draws a straight line between an idle and a full-load draw for each vCPU: 0.74 W to 3.5 W on AWS on average, and 1.04 W to 4.16 W for recent Intel Sapphire Rapids chips. The Green Software Foundation's Software Carbon Intensity specification, published as ISO/IEC 21031:2024, has the same shape (energy times grid intensity, plus embodied emissions, per unit of work), and it ignores renewable certificates and offsets, so only real reductions lower the score.
Consider one m7i.xlarge, four vCPUs at 50% CPU, running for a month. With CCF's coefficients it draws about 10.4 W of IT load, or 8.62 kWh over 730 hours once PUE is applied, and it costs $147.17 at the on-demand price in Northern Virginia. On that region's grid, which Google's 2025 data puts at 343 g of CO2e per kWh, the month emits about 2.96 kg of CO2e. The same instance in Montréal, at 11 g per kWh, emits about 0.095 kg, roughly 31 times less, for an 11.5% higher price. Left completely idle, the instance still uses 3.45 kWh a month, 40% of the busy figure. (Our arithmetic on CCF's coefficients; read it as an order of magnitude.)
Scale it the way waste scales, in dollars. At that rate, each $100,000 of on-demand compute nobody needed is about 5.9 MWh of electricity and 2 tonnes of CO2e in Northern Virginia, or 64 kg in Montréal. A spend-based estimate using the US EPA factor for hosting services, 93 g of CO2e per dollar, would give 9.3 tonnes for the same $100,000. The gap between those two numbers is the honest error bar on cloud carbon today.
Manufacturing changes the picture again. CCF spreads a server's embodied emissions over a four-year life, in proportion to the share of the machine an instance reserves. For a comparable m5.xlarge that adds about 1.4 kg of CO2e a month wherever it runs: about a third of the total in Northern Virginia, and 94% in Montréal. On a clean grid the hardware is most of the footprint, and moving a workload to a cleaner region does nothing about it. Deleting the workload does.
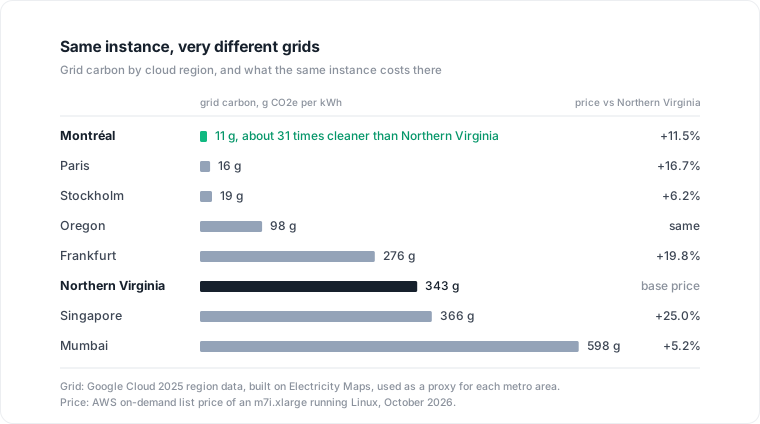
Carbon per kWh varies 54 times across these regions, while the price of the same instance varies by a quarter at most, and not in the same order.
Where the waste hides in data infrastructure
The surveys and cluster reports above describe compute in general. A data platform has its own patterns, because its bill is spread across lakehouse and warehouse compute, lake storage, pipelines, dashboards, the models on top and the operational databases underneath, each with defaults that keep things running. Here is where the idle capacity sits, layer by layer, and what the vendors' own documentation says about it.
Warehouses and clusters that never sleep
Cloud warehouses bill for time and size, and their defaults lean toward staying awake. Snowflake bills per second with a 60-second minimum each time a warehouse starts, suspends an idle warehouse only after 600 seconds by default, and doubles the credits per hour at each size step, from 1 for X-Small to 512 for 6X-Large on its first-generation warehouses. On multi-cluster warehouses, the default scaling policy starts extra clusters rather than conserve credits; the Economy policy adds one only when there is enough load to keep it busy for at least six minutes. Databricks puts it plainly: "Idle SQL warehouses continue to accumulate DBU and cloud instance charges until they are stopped," its documentation says, with auto stop defaulting to 45 minutes on pro and classic warehouses, 10 minutes on serverless, and the default size set to X-Large. An all-purpose cluster stops only when its inactivity timer fires, and one created through the API without an auto-termination value is never terminated. A provisioned Redshift cluster bills on demand until someone pauses it.
Each default is reasonable on its own. Together they mean a warehouse that answers one burst of queries and then waits keeps billing, with its servers on, for ten to forty-five minutes. One cost vendor reported that 34% of Snowflake warehouse spend came from warehouses running without executing a query, across dozens of customer environments, without publishing its method. Snowflake's own Optimization insights treat the pattern as routine: they flag warehouses idle for more than half of their active time, multi-cluster warehouses whose minimum equals their maximum so every cluster runs all the time, and tables over 100 GB that are written but never read.
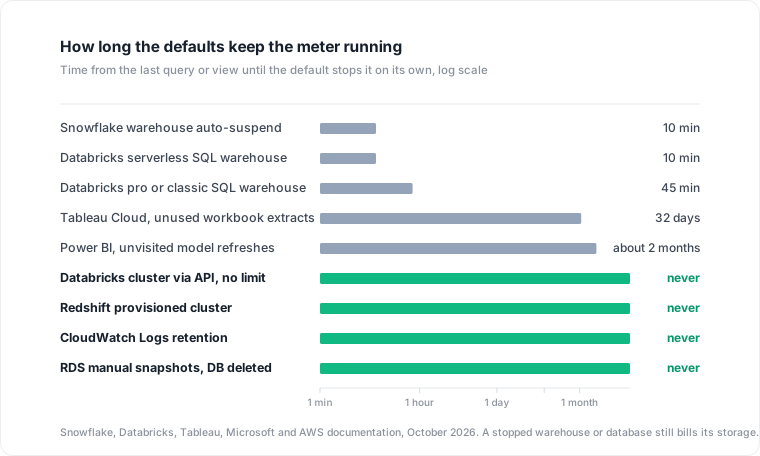
Most of the defaults err toward staying on. The question is how long after the last use the meter stops, and for several it never does.
Oversizing compounds it. A size step doubles credits per hour, and it pays off only when the query can use the extra compute. Small and I/O-bound queries often cannot, so the bigger warehouse mostly buys idle cores.
Queries that scan the whole lake
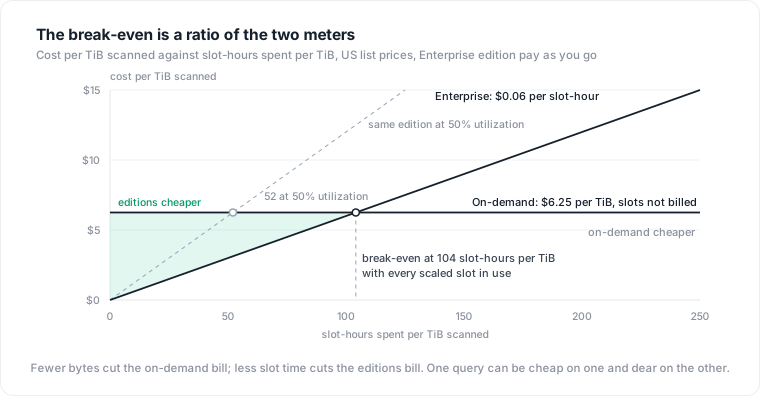
BigQuery on-demand charges $6.25 per TiB processed, counted on the columns a query references, and on a non-clustered table a LIMIT clause does not reduce the bytes read. A SELECT * on a wide table pays for every column, and a missing partition filter pays for every day of history. Google's own first recommendation is to partition and cluster tables wherever possible.
File format sets the floor. In AWS's Athena pricing example, the same single-column query costs $15 on a 3 TB uncompressed text table, $5 after GZIP, and $1.25 on compressed Parquet, because a columnar file lets the engine read only the column it needs: 0.25 TB instead of 3. Uber measured 79% smaller files after moving uncompressed Hive tables to ZSTD, and 39% smaller after moving from Snappy, with read compute on some queries falling three to four times. Plenty of lake data still sits in the slow formats: in Amazon's study of its own Redshift fleet, half of the queries reading external data read uncompressed files, and 99% of the compressed ones were gzip, which cannot be split for parallel reads.
Engines also redo work they have already done. The same study found that in half of the clusters, 80% of queries were exact repeats of earlier ones, yet the result cache hit only about 20% of the time, partly because new data lands every few minutes and invalidates cached results. Most repeated questions get computed again from scratch.
Pipelines that rebuild what did not change
The Redshift study found that CREATE TABLE AS SELECT statements, the usual way pipelines rebuild tables, were about 1.9% of queries but 16.4% of the load, and that about 80% of those tables were read by only one query. A full refresh reads a table's whole history to add one day of data, while an incremental run reads only the new rows. Snowflake recommends incremental refresh for dynamic tables when less than 5% of the base data changes between refreshes, which describes most append-only fact tables. A medallion layout keeps raw, cleaned and modelled copies of the same records, and when each layer is rebuilt in full on a schedule, the copies multiply the compute as well as the storage.
Schedules multiply everything. An hourly model runs 24 times as often as a daily one, and nobody revisits the choice once the dashboard works. When dbt Labs tuned its own project to skip models whose sources had no new data and to match refresh frequency to what consumers needed, compute fell 64%: 9 points from the engine feature and 55 from tuning freshness. It is a vendor's own project, but the split is the useful part. Most of the saving came from asking how fresh the data really had to be.
Streaming is the always-on version of the same choice. Databricks' default trigger checks for new data continuously for a latency of three to five seconds, and its documentation warns that the default can generate a high volume of cloud storage API calls per day. Data that arrives in batches can use the availableNow trigger instead, which processes what is there and stops.
Dashboards refreshing for nobody
BI tools refresh on a schedule whether or not anyone looks. Power BI allows up to 48 scheduled refreshes a day on Premium and Fabric capacity and pauses a schedule only after two months with no visitors, which at the maximum rate is about 2,900 refreshes of a report nobody opened. Each refresh also invalidates the cached query results, so a report refreshed 48 times a day re-queries the warehouse almost every time someone does open it. Tableau Cloud suspends full extract refreshes after 32 days of inactivity, and only for schedules more frequent than weekly. Vendors do not build features like these for rare cases.
Dashboards that are used keep the warehouse busy too. Amazon describes live dashboards on Redshift as high-concurrency, latency-sensitive workloads with a p95 under three seconds, where new data every few minutes limits how much caching can help. No credible study measures how many dashboards go unused, though, and the widely shared 60% to 80% figures trace back to no published data.
Lakes and storage: data nobody reads
Storage is where waste hides best, because nothing breaks when data sits unread. Surveys have put the unused share high for a decade. In 2016 Veritas found that 85% of stored data was either dark (nobody knows what it holds) or redundant, obsolete or trivial. Splunk put dark data at 55% in 2019, and an IDC survey for Seagate found that 68% of data available to enterprises goes unused in 2020. These are estimates from IT leaders, not scans of real systems, but they all land in the same range. Snowflake's insights now flag the lake-scale version: tables holding 100 GB or more of files that no query has touched in a year.
Storage draws power whether anyone reads it or not. On Azure, Microsoft and Carnegie Mellon researchers measured I/O on hard-drive clusters rising 61% over a week while power stayed flat, because the drives spend most of their power spinning. On SSD clusters, a 28% drop in I/O cut power by 0.04%. The same paper attributes 33% of operational emissions and 61% of embodied emissions in Azure's general-purpose cloud to storage. In energy terms, unread data costs about as much as busy data.
Every byte is also stored more than once. S3 Standard spreads data across at least three zones, and Aurora keeps six copies across three Availability Zones. The platforms add their own history on top. Snowflake charges storage "regardless of whether it is in the Active, Time Travel, or Fail-safe state": Time Travel keeps one day of history by default and up to 90 days on Enterprise, Fail-safe adds a non-configurable seven days, and for tables that change often Snowflake warns that this history "can be much larger than the active table storage." Delta Lake keeps deleted data files for seven days by default until someone runs VACUUM, and its log files for 30; Databricks recommends running VACUUM regularly to cut storage costs. Then come the medallion layers, snapshots, dev copies and exports. The open Cloud Carbon Footprint model uses replication factors of six for S3 and Aurora, three for snapshots and backups, and two for EBS. With its storage coefficients of 0.65 Wh per terabyte-hour for hard drives and 1.2 for SSDs, plus AWS's modelled PUE of 1.135, a forgotten terabyte in S3 works out to roughly 39 kWh a year and a terabyte in Aurora to about 72 kWh (our arithmetic). The coefficients come from 2016 projections, and real systems use erasure coding (a cheaper way than full copies to survive disk failures), so read these as upper-end estimates. The direction holds: each logical terabyte is several physical ones.
Defaults do the rest. CloudWatch Logs keeps log data indefinitely unless you set a retention period. RDS manual snapshots survive the deletion of their database. Log volumes are growing fast: respondents to a Dynatrace survey reported a 93% jump in a year, with logs taking nearly half of observability budgets. Tiering is underused: in Vantage's data, only 37% of S3 storage spend sits outside the Standard tier. One default works the other way: BigQuery halves the storage price of a table that has not been modified for 90 days.
The fix is fewer devices: delete first, then tier, then keep hardware longer. SSD racks carry about ten times the embodied carbon per terabyte of hard-drive racks, so cold data does not belong on them, and the same paper notes that stretching hardware life from three to six years halves its embodied emissions.
The databases underneath: idle, oversized, out of support
The operational databases that feed the platform waste in quieter ways. The cloud providers agree on what an idle database looks like, and their definitions are generous: AWS Trusted Advisor flags an RDS instance with no connection in seven days, Compute Optimizer wants no connections and low CPU and I/O over 14 days, and Cloud SQL looks at the last 30 days. A single nightly health check keeps a dead database off every list. Nobody publishes how many fail these tests, but spend outside production is measured: Vantage puts non-production at 23% of cloud costs. Development and staging databases sized like production, running all weekend, are the classic case. A business-hours schedule cuts instance-hours from 168 to 50 a week, which is where AWS's "up to 70%" comes from, and a stopped RDS instance restarts itself after seven days while its storage and backups keep billing.
Sizing and generation matter as much as the box. In Datadog's 2024 data, 83% of organizations still ran previous-generation instance types, and AWS claims its Graviton4 database instances deliver up to 40% more performance than Graviton3, with Graviton using "up to 60% less energy" than comparable instances (an EC2-wide vendor claim, not a database measurement). Inside the engine, Microsoft's paper on auto-indexing Azure SQL Database counted 3.4 million recommendations to drop indexes that helped no query and found tens of thousands of databases where total CPU fell by more than half once the right indexes were in place. Lab work ties this to energy: on PostgreSQL 16, indexing cut the server-side energy of 16 of 22 TPC-H queries by between 3.33% and 99.97% (Cedeño et al., 2024). On a provisioned instance, a query fix saves energy only when it lets you shrink the instance or drop a replica, which is why autoscaling turns query waste into billed compute instead of removing it.
Some database waste has no energy behind it at all. AWS charges RDS Extended Support on engines past the end of standard support, $0.100 per vCPU-hour in years one and two and $0.200 in year three in its Oregon example, or $7,008 over three years for a single two-vCPU instance, with standbys and read replicas charged too. The server and its kilowatt-hours stay the same; only the bill grows. We covered the mechanics in RDS Extended Support pricing. Upgrading can also cut work: PostgreSQL 17's vacuum uses up to 20 times less memory, and PostgreSQL 18's asynchronous I/O has shown up to three times faster reads, both best-case figures from the project itself.
AI on top: GPUs waiting for work
AI is the newest and most expensive place to sit idle. CAST AI found average GPU utilization of 5% across the clusters it analyzed, with roughly 20 times more GPU capacity than workloads consumed at any moment. Production traces agree from different angles. In Alibaba's GPU cluster in 2020, the median task used 0.042 of a GPU's compute. On Alibaba Cloud's model marketplace, 17.7% of about 30,000 GPUs were reserved to serve 1.35% of requests, and pooling those models cut the GPUs needed from 1,192 to 213. Even Meta's flagship Llama 3 training ran at 38% to 43% of peak compute.
A waiting GPU still runs warm. A 2026 preprint measured an H100 at about 72 W bare idle and 122 W with a model loaded but serving nothing, and production telemetry on 14 H100s averaged about 146 W in that loaded state. Another preprint found that GPUs allocated but doing nothing visible accounted for between 7% and 65% of energy when replaying industry serving traces. Both are preprints with small samples, but they match LBNL's assumption that AI servers idle at about 20% of rated power.
Model choice is the other lever. Google reports that its median Gemini text prompt used 0.24 Wh in May 2025, with 10% of that from idle machines held in reserve, after a 33-fold drop in energy per prompt over one year, mostly from software. Reasoning modes can wipe out gains like that for routine work: Hugging Face's AI Energy Score found the same open model using 150 to 700 times more energy with reasoning turned on, and the IEA notes that reasoning and agentic tasks can use hundreds or thousands of times more energy per query than simple text generation. Sending a lookup question to a reasoning model is the AI version of running a 4X-Large warehouse for a ten-row query. And the agents and copilots now sitting on the platform are query clients like any other: an agent that writes SELECT * against a wide table pays for every column, so the scan discipline above applies to them too.
When saving money and saving carbon disagree
For waste, cost and carbon point the same way. Delete an idle warehouse or database and the bill, the kilowatt-hours and the reserved hardware all go down together. The FinOps Foundation's sustainability capability tells practitioners to "treat usage efficiency as the primary lever for both cost and carbon reduction." Beyond waste, the two part ways in four places.
The first is region choice. AWS charges the same $0.2016 an hour for an m7i.xlarge in Northern Virginia, Ohio and Oregon, three grids that Google's data puts at 343, 343 and 98 g per kWh, and 11.5% more in Canada (Central), where the grid is about 31 times cleaner. A team chasing the cheapest region can move work onto a dirtier grid without noticing.
The second is fees with no energy behind them. On the same hardware in Northern Virginia, Windows licensing nearly doubles the hourly price (+91.3%), RDS Extended Support adds $0.10 to $0.20 per vCPU-hour, and a three-year reservation cuts the price by about 55%. None of the three changes a single watt. Any estimate built from spend misreads all three. The FinOps Foundation also warns that rate commitments can discourage scaling down, which turns a discount into a reason to keep idle capacity.
The third is the "100% renewable" claim, which is annual accounting. Google and Amazon both report matching all of their electricity with renewable purchases over the year. The grid tells another story: Google's market-based Scope 2 emissions were 2.8 million tonnes in 2025, against 15.1 million on a location basis, and its Iowa region runs at 88% carbon-free energy by Google's own count on a local grid of 432 g per kWh. Provider figures can also move for reasons unrelated to your workload: AWS says its market-based factors for several North American regions rise from January 2026 as Amazon winds down unbundled certificates. Use location-based figures for decisions and keep market-based ones for disclosure.
The fourth is rebound. Energy per AI task is falling by at least an order of magnitude a year, the IEA says, and data center demand still grew 17% in 2025. Researchers have warned that AI efficiency gains can raise total consumption, the old Jevons effect. A saving that gets spent on more compute leaves total emissions where they were. If carbon is part of the goal, lower the budget along with the waste.
A playbook, in order of impact
The order matters. Removing waste saves money and carbon at once, so it pays for everything that comes after it.
- Map the estate and its owners. List every database, warehouse, cluster, pipeline and bucket with its owner, monthly cost and last real use. Idle resources mostly survive because nobody is sure they are safe to remove.
- Stop what nobody uses. Treat the vendors' idle tests as a floor, since a health check, a replication stream or a scheduled refresh can make a dead resource look alive. Snapshot, delete, and put the snapshot on a retention clock.
- Put non-production on a schedule. Business hours cut instance-hours by up to 70%. Automate the restart problem, because RDS starts a stopped instance again after seven days.
- Right-size, then modernize. Size warehouses and clusters to the query rather than the worst day, size instances to measured peaks rather than the launch-day guess, move off previous-generation instances, try ARM where your engine supports it, and drop Multi-AZ on databases that do not need it: on RDS it doubles the instance and storage price.
- Shrink storage before tiering it. Set retention on logs, snapshots, backups, Time Travel and table history, delete data nobody can name, then tier what is left. Every logical terabyte is several physical ones.
- Cut the work, not only the box. Partition and cluster large tables, keep SELECT * out of scheduled jobs on wide tables, store analytics data in compressed columnar formats, keep the indexes that earn their keep and drop the rest, and make pipelines incremental. Match refresh schedules to how often people read the result.
- Let idle compute sleep. Shorten warehouse auto-suspend where gaps between queries are long (the 60-second billing minimum makes going much lower pointless), set auto-termination on every cluster, including those created through the API, and unload or pool idle models on GPUs.
- Put the grid next to the price. For new or movable batch and analytics work, compare grid intensity before you pick a region. Moving work once to a cleaner region beats shifting it by the hour: a EuroSys 2024 study found that one move to the greenest region captures most of the achievable savings, while Google's own time-shifting cut cluster power by 1% to 2% in the dirtiest hours.
- Measure energy and carbon next to cost. Provider tools now report monthly emissions by service and region: AWS replaced its Customer Carbon Footprint Tool with the AWS Sustainability service in June 2026, Google Cloud's Carbon Footprint reports both accounting methods, and Microsoft is moving customers to Azure carbon optimization. Use them for disclosure, use an open model like CCF for decisions, and report kWh and CO2e per workload next to dollars.
Why this lands on data teams now
Power has become the constraint on the build-out itself. Hyperscaler capital spending passed $400 billion in 2025 and is expected to rise another 75% in 2026, while the IEA points to shortages of gas turbines, grid connections and memory chips that limit how fast new capacity can arrive. When capacity is scarce, the cheapest new capacity is the capacity already built and sitting idle.
Reporting rules are also reaching cloud use, mostly through Scope 3, where a buyer's cloud consumption usually lands as purchased services (BSR, 2026). In the EU, the CSRD now covers companies with more than 1,000 employees and over €450 million in turnover from financial year 2027, and the revised standards keep Scope 3 reporting mandatory for them. In California, companies with more than $1 billion in revenue file their first Scope 1 and 2 reports under SB 253 by November 10, 2026, with Scope 3 from 2027. In Canada the CSSB standards are voluntary, but OSFI's Guideline B-15 requires federally regulated banks and insurers to disclose Scope 3 from fiscal 2028.
Facility rules are tightening too. Under the EU Energy Efficiency Directive, every data center of 500 kW or more reports its energy and water use each year. 770 reported in the first round, about 36% of those in scope, and an A-to-G rating label adopted in September 2026 should produce its first labels in 2027. Germany's Energy Efficiency Act already caps PUE at 1.2 for data centers that open from July 2026. These rules grade the building. Whether the servers inside it do useful work stays the customer's job, and no data center operator can do that part for you.
Cost will probably start the work anyway. In Flexera's 2026 survey, 56% of respondents put cost optimization ahead of sustainability, and 30% treated the two as equal. For waste, the motive barely matters: the cleanup that shrinks the bill also shrinks the power draw.
Where Datapace fits
Most of the waste in this article survives because nobody can see the whole estate at once: which database still has users, which table feeds which dashboard, and what each piece costs. Datapace is building that view: one map of the data estate, covering databases, warehouses, pipelines and what consumes them, with usage and cost attached. Agents work from the map and propose changes, such as suspending an idle warehouse, parking a forgotten database or turning a full refresh into an incremental one, as pull requests your team reviews and merges. Cost is where it starts, and the same map serves performance work, migrations and AI on the data. Every dollar of waste that leaves the bill is power that no longer has to be drawn. If your data platform bill grows faster than anyone can explain, book a call.
Sources
- IEA, Energy and AI: Executive summary and Energy demand from AI, April 2025 (415 TWh in 2024, 1.5% of world electricity; 45% US, 25% China, 15% Europe).
- IEA, Key Questions on Energy and AI, April 2026 (485 TWh in 2025, up 17%; AI-focused data centers up 50%; 950 TWh by 2030; hyperscaler capex; energy per AI task).
- Central Statistics Office Ireland, Data Centres Metered Electricity Consumption 2025, July 2026 (23% of metered electricity).
- Lawrence Berkeley National Laboratory, United States Data Center Energy Usage Report: 2025 Update, June 2026 (192 TWh in 2024, 4.7%; 11.8% by 2030 in the reference case).
- Lawrence Berkeley National Laboratory, 2024 United States Data Center Energy Usage Report, December 2024 (idle power 36% of maximum in 2023; utilization by data center type; AI servers idling at 20%).
- PJM Independent Market Monitor, Market Monitor Report, July 27, 2026 ($29.4 billion, 46.2% of capacity charges over four auctions), and PJM, 2028/2029 Base Residual Auction results, July 14, 2026 (6,831 MW short).
- EPRI, Powering Intelligence: Updated U.S. Data Center Scenarios, February 2026.
- Google, 2026 Environmental Report (data center electricity, emissions, PUE 1.09, market-based and location-based Scope 2).
- Microsoft, 2026 Environmental Data Fact Sheet (electricity consumption FY20 to FY25), and Microsoft datacenter sustainability (PUE 1.17).
- Amazon, 2025 Sustainability Report (80.85 million tonnes; electricity emissions up 34%; PUE 1.14).
- Uptime Institute, Global Data Center Survey 2026 (industry PUE 1.52; 37% of operators collect server utilization).
- Flexera, 2026 State of the Cloud Report (29% estimated waste, 753 respondents; cost versus sustainability priorities). Self-reported survey.
- Gartner, public cloud end-user spending forecast, November 19, 2024, and IT spending forecast, October 21, 2026.
- Harness, FinOps in Focus 2025, February 2025 ($44.5 billion, 21% of 2025 IaaS spend). Vendor survey.
- CAST AI, 2026 State of Kubernetes Optimization Report, April 2026 (8% CPU, 20% memory, 5% GPU utilization). Vendor telemetry.
- Datadog, State of Cloud Costs 2024 (83% of container costs idle; previous-generation instances; gp2 share). Vendor telemetry, AWS only.
- FinOps Foundation, State of FinOps 2025 and State of FinOps 2026, and Sustainability capability.
- Barroso and Hölzle, The Case for Energy-Proportional Computing, IEEE Computer, 2007.
- Tröpgen, Schöne, Ilsche and Hackenberg, 16 Years of SPEC Power, 2024 (idle draw 25.7% of full load in 2024).
- Koomey and Taylor, Zombie/Comatose Servers Redux, Anthesis, 2017.
- Cloud Carbon Footprint, Methodology and AWS estimation constants (vCPU, storage and memory coefficients, PUE, replication factors).
- Green Software Foundation, Software Carbon Intensity specification, published as ISO/IEC 21031:2024.
- Google Cloud, Carbon free energy for Google Cloud regions (2025 grid intensity by region).
- AWS, EC2 On-Demand pricing (m7i.xlarge by region and operating system, October 2026), and Vantage, m7i.xlarge pricing (reserved and spot prices, third-party mirror).
- US EPA, Supply Chain Greenhouse Gas Emission Factors v1.3 (NAICS 518210, 0.093 kg CO2e per dollar).
- AWS, Trusted Advisor cost optimization checks, Compute Optimizer idle recommendations and RDS recommendations.
- Google Cloud, Cloud SQL idle instance recommender and overprovisioned instance recommender.
- Vantage, Cloud Cost Report Q1 2025 (non-production 23% of cloud costs; 37% of S3 storage spend outside Standard). Vendor telemetry.
- AWS, Instance Scheduler on AWS, Stopping an RDS DB instance, Estimating RDS Extended Support charges and RDS for PostgreSQL pricing.
- Das et al., Automatically Indexing Millions of Databases in Microsoft Azure SQL Database, SIGMOD 2019.
- Cedeño et al., An Evaluation of the Impact of End-to-End Query Optimization Strategies on Energy Consumption, ENASE 2024.
- PostgreSQL Global Development Group, PostgreSQL 17 Released and PostgreSQL 18 Released; AWS, Graviton and RDS Graviton4 instances. Vendor claims.
- Veritas, Global Databerg Report, 2016; Splunk, The State of Dark Data, 2019; Seagate and IDC, Rethink Data, 2020. Surveys.
- McAllister et al., A Call for Research on Storage Emissions, HotCarbon 2024.
- AWS, Aurora availability and durability, S3 storage classes, CloudWatch Logs log groups and RDS backups.
- Dynatrace, State of Log Management, 2026. Vendor survey.
- Snowflake, Overview of warehouses, CREATE WAREHOUSE, Multi-cluster warehouses, Optimization insights, Dynamic table refresh, Time Travel, Fail-safe and Data storage considerations.
- Databricks, Create a SQL warehouse, Clusters API, Structured Streaming triggers and VACUUM; AWS, Pausing and resuming a Redshift cluster.
- PointFive, blog post on idle Snowflake warehouse spend, May 2026. Vendor telemetry, method not disclosed.
- Google Cloud, BigQuery pricing and Controlling costs in BigQuery; AWS, Amazon Athena pricing.
- Uber Engineering, Cost Efficiency @ Scale in Big Data File Format, 2022.
- van Renen et al., Why TPC Is Not Enough: An Analysis of the Amazon Redshift Fleet, VLDB 2024.
- dbt Labs, blog post on compute cost reduction with Fusion and state-aware orchestration, February 2026. Vendor case study.
- Microsoft Learn, Data refresh in Power BI; Tableau, Automatically suspend extract refreshes for inactive workbooks.
- Weng et al., MLaaS in the Wild, NSDI 2022; Xiang et al., Aegaeon: Effective GPU Pooling for Concurrent LLM Serving on the Market, SOSP 2025; Meta, The Llama 3 Herd of Models, 2024.
- Vadari, The Model Parking Tax, 2026, and Lei et al., The Energy Cost of Execution-Idle in GPU Clusters, 2026. Preprints.
- Elsworth et al., Google, Measuring the environmental impact of delivering AI at Google Scale, August 2025. Self-reported.
- Luccioni and Gamazaychikov, Hugging Face, AI Energy Score v2, December 2025; Luccioni, Strubell and Crawford, paper on Jevons' paradox in AI, FAccT 2025.
- Sukprasert et al., On the Limitations of Carbon-Aware Temporal and Spatial Workload Shifting in the Cloud, EuroSys 2024; Radovanović et al., Google, Carbon-Aware Computing for Datacenters, 2021.
- AWS, AWS Sustainability and Customer Carbon Footprint Tool release notes; Google Cloud, Carbon Footprint methodology; Microsoft, Azure carbon optimization.
- BSR, Accounting for Scope 3 Use-Phase Emissions for Software Companies, February 2026.
- EY, EU Sustainability Developments, Issue 14, July 2026; Thompson Hine, CARB's final climate disclosure rule, October 2026; OSFI, Guideline B-15.
- European Commission, Report on the energy efficiency of data centres in the EU, COM(2026) 500, September 2026; Germany, Energy Efficiency Act, section 11.