TL;DR. Neon published fleet numbers for autoscaling on Lakebase Postgres: the average production database changes compute size 32,016 times a month, resized by an agent that samples every 20 seconds and estimates the working set with a sliding-window HyperLogLog over unique pages accessed. That loop genuinely ends capacity planning, and one whole class of database cost with it. But the estimator counts pages touched, not pages needed. It cannot tell a growing business from a regressed plan, so query-level waste does not get fixed by autoscaling. It gets scaled, and then it gets billed.
Once every 81 seconds: that is how often the average production database on Neon changes its compute size, per the fleet numbers Neon published for Lakebase Postgres autoscaling. Not the fleet in aggregate, the average single database: 32,016 resizes a month, in both directions, while connections stay open. The post's argument is that sizing a Postgres instance is no longer a decision a human should make, and for the class of cost that argument addresses, it is correct. The interesting question is the class of cost it leaves behind, because that class does not shrink when the control plane absorbs capacity planning. It becomes the whole bill.
The resize loop, mechanically
The architecture underneath is worth understanding precisely, because its limits fall directly out of its inputs. Neon runs Postgres inside lightweight VMs on Kubernetes. An autoscaler-agent on every node collects metrics from the Postgres VMs on that node every 20 seconds, computes a target size, and initiates scaling; a vm-monitor inside the compute responds to sudden memory pressure without waiting for the next tick, and when a node runs out of slack, QEMU live migration moves the running VM elsewhere with its TCP connections intact.
The signal doing most of the work is the working-set estimate. Neon maintains a modified HyperLogLog with a sliding window over the pages the workload accesses, giving a cheap, continuously updated estimate of how many distinct pages the database touched over every horizon from the last minute to the last hour. The autoscaler sizes compute so that this estimated working set fits in memory, growing the local file cache when the workload's footprint grows and shrinking compute when it recedes. When load stops entirely, compute can suspend and restart in around 350 milliseconds on the next connection.
None of this is possible on a classic instance, which is why the classic instance came with a sizing ritual. What makes the loop safe is separated storage and compute: the data lives in a storage tier that does not care how big the compute in front of it is, so resizing is a scheduling operation rather than a migration. Provisioned Postgres priced peak load plus a safety margin, around the clock, and the margin was pure waste. Neon reports production databases using 2.4x less compute, and costing about half as much, as provisioned equivalents; the number is vendor-reported and self-serving, but the direction is not controversial. Idle headroom was a real cost class, autoscaling deletes it, and now that the resize loop runs inside Databricks' own Postgres control plane rather than a third-party tool, that deletion is becoming a platform default rather than an optimization you buy.
The estimator counts pages touched, not pages needed
Look again at what the HyperLogLog actually measures: the cardinality of the set of pages the workload accessed. There is no term in that estimate for whether the access was necessary.
An index scan that answers a query by touching forty pages and a sequential scan that answers the same query by touching four million both show up in the estimator as exactly what they are: a working set of forty pages, or a working set of four million. When a plan regresses, because an index was dropped, a table crossed a statistics threshold, or the planner's row estimate went wrong, the working set inflates, the estimator faithfully reports the inflation, and the autoscaler does its job: it buys enough memory to fit the new footprint. Latency recovers. The graphs settle. The only artifact of the regression is a compute line item that is larger than last month's.
From inside the resize loop, a regressed plan and a grown business are the same event. Both present as more pages touched, and the loop has no third input that could tell them apart. That is a structural property, and it is a defensible design choice: an autoscaler that second-guessed your queries before granting memory would be a much more dangerous product. But it means autoscaling changes what a performance regression looks like from the outside. On a provisioned instance, the bad plan announced itself: latency climbed, CPU pinned, someone got paged, and the investigation started that day. Under autoscaling, the same regression is absorbed silently at the next 20-second tick and surfaces weeks later as a billing anomaly, long after the deploy that caused it has scrolled out of everyone's short-term memory. The failure got quieter and more expensive at the same time.
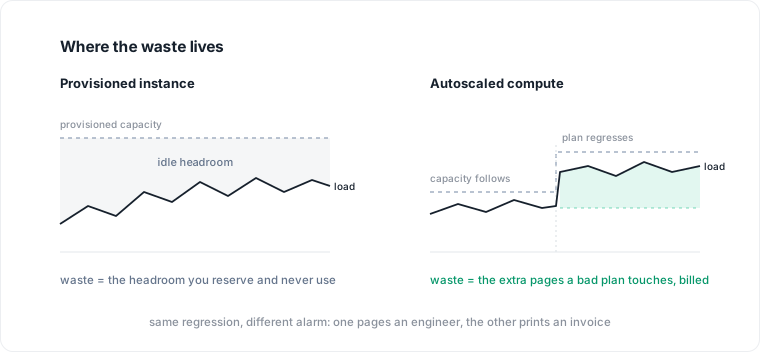
Autoscaling moves waste from headroom, where it is idle and visible, into the workload, where it is billed and silent.
Consumption pricing makes the query bill the whole bill
This would matter less if autoscaling were an optimization a minority opted into. It is instead where managed-database pricing is converging. Aurora Serverless v2 bills per ACU-second as capacity tracks load. Aiven just moved its managed Kafka off instance tiers entirely, onto pure consumption billing, and pricing motions like that rarely stay confined to one product line. Databricks shipping fleet-wide autoscaling as the default Lakebase experience is the same move from the other direction: the vendor absorbs sizing into the control plane and bills you for what the workload demanded.
Under that model, the two components of the old database bill collapse into one. Provisioning waste, the gap between what you reserved and what you used, goes to zero by construction. What remains is exactly the workload: every buffer your queries touched, priced at whatever compute size they forced. Consumption billing is honest in a way provisioned billing never was, and the honesty cuts both ways. Your bill now reflects your queries with high fidelity, which means your inefficiencies are no longer diluted across a flat reservation you were paying for anyway. A query that does 100x the necessary I/O used to cost you latency and occasional pages; on metered autoscaled compute it costs you 100x, continuously, itemized nowhere.
Itemized nowhere is the operative problem. The bill arrives aggregated to the database, and the resize events are attributed to nothing. Postgres itself holds the per-query evidence in pg_stat_statements, but that view has its own eviction and attribution problems, and no managed platform today draws the line from "compute scaled from 2 to 8 units at 14:32" to the statement fingerprint that caused it. The autoscaler knows the working set grew; the statistics view knows which queries read how many blocks; the invoice knows what the month cost. Nothing joins the three.
Watch the half the loop can't see
None of this argues against autoscaling. Turning it off buys back the old waste class without recovering any visibility; the provisioned instance never itemized query cost either, it just hid the meter. The argument is that autoscaling quietly transfers a job that used to do itself. Capacity pain was an alarm system: crude, unpleasant, but impossible to ignore. Remove it and plan regressions need to be caught on purpose.
Practically, that means treating per-query I/O as a release metric rather than an incident artifact. Snapshot pg_stat_statements before and after deploys and diff shared block reads per statement, because a regression that autoscaling absorbs will appear there weeks before it appears in finance's spreadsheet. Alert on sustained upward steps in the working-set and compute-size metrics your platform exposes, and treat an unexplained step as a performance incident even though nothing is slow, because "nothing is slow" is precisely what the autoscaler is for. And keep the scaling floor and ceiling as deliberate settings: the ceiling is the one place the old, visible failure mode still exists, and where you set it decides whether a runaway plan costs you money or availability.
The general rule: an autoscaler is a demand-follower. It optimizes the supply of compute against the demand curve your queries draw, and it does that well enough that supply-side waste is disappearing as a category. It cannot ask whether the demand curve itself is legitimate. That question needs evidence the resize loop does not have: which statements drew the curve, what they touched, and whether what they touched was necessary.
Where Datapace fits
The gap this leaves is an attribution gap, and it is one of the things Datapace is being built to close. Datapace is building the context layer between your databases and your AI: resolved schema meaning validated by the people who own the data, the workload evidence beside it on the same graph (cost, performance, usage and freshness, lineage), and a policy gate over what an agent may do and access, served over MCP. In that model, "compute stepped up on Tuesday" and "this statement's block reads tripled on Tuesday" are adjacent facts about the same objects rather than entries in three disconnected systems, which is what an answerable version of "which query bought the resize" requires, whether the asker is an engineer or an agent. If your Postgres bill floats free of your query stats today, book a call.
Sources
- Neon, Autoscaling Lakebase Postgres, September 2026 (32,016 resizes per month for the average production database; 20-second sampling; 2.4x compute and roughly 50 percent cost reduction versus provisioned, vendor-reported; scale-to-zero restart around 350 ms).
- Neon, Dynamically estimating and scaling Postgres' working set size (sliding-window HyperLogLog estimator over unique pages accessed, windows from 1 to 60 minutes).
- neondatabase/autoscaling, GitHub repository (autoscaler-agent, vm-monitor, NeonVM, custom scheduler, QEMU live migration).
- AWS, Aurora Serverless v2 documentation (ACU-based capacity, per-ACU-second billing).
- Aiven, Pay for what you stream: consumption-based Kafka pricing, August 2026.