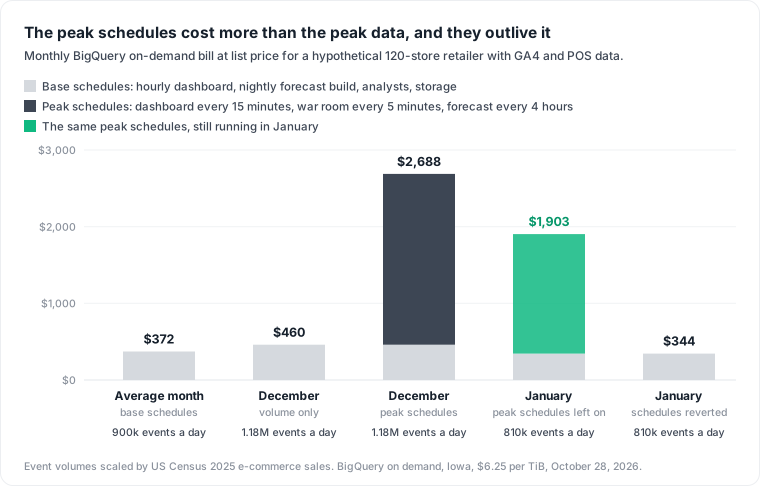
TL;DR. A retail data warehouse is small and its bill follows the refresh schedule more closely than the sales curve. For a hypothetical 120-store retailer with a web shop on BigQuery on demand, an average month costs $372 at list price. December's 31% extra data, the US e-commerce peak in 2025, adds $88. The schedules added for the season add $2,228, for a $2,688 month. If they keep running into January, the bill is $1,903 on less data than an average month: about $15,600 over the ten months to the next peak.
Retail data warehouse cost is driven by how often you read the data, far more than by how much of it you keep. This post prices one hypothetical retailer from Google's list prices, read on October 28, 2026, and scales its volumes with the US Census Bureau's monthly retail sales. It is a worked model: no query ran on a real account. The method carries over to Snowflake or Redshift; the rates for those are in data warehouse cost on four platforms.
A 120-store retailer stores 735 GB and pays $13 for it
Consider a hypothetical retailer with 120 stores and a web shop, running its retail data platform on BigQuery in Iowa (us-central1). Four sources feed it:
| Source | Assumption | Volume a month |
|---|---|---|
| GA4 web events | 900,000 events a day, daily export | 45 GB |
| POS line items | 120 stores, 900 tickets a day, 3.5 lines each, 200 bytes a row | 2.3 GB |
| Inventory snapshots | 120 stores, 20,000 SKUs, one row each a day, 50 bytes a row | 3.6 GB |
| Shopify orders | Synced by a connector | Small next to events |
The event size is Google's own estimate: "1 gigabyte equates to approximately 600,000 Google Analytics events". So 900,000 events a day is 1.5 GB a day, and web events outweigh store data almost eight to one.
Keep 13 months of events and two years of POS and inventory, and the warehouse holds about 735 GB. BigQuery bills active logical storage at $0.000031507 per GiB-hour in Iowa, about $0.023 a month, and drops the rate for any table or partition "that has not been modified for 90 consecutive days" to $0.000021918, about $0.016. GA4 writes one table per day, so daily tables that are no longer written age into the cheaper rate, and so does old POS and inventory history. Storage costs about $13 a month. Every other dollar in this model is compute.
An average month costs $372, mostly dashboard refreshes
BigQuery on demand charges "$6.25 / 1 tebibyte" processed, and "The first 1 TiB of query data processed per month is free." Three workloads run in an average 31-day month:
| Workload | Schedule | Bytes per run | TiB a month | Cost |
|---|---|---|---|---|
| Trading dashboard, 10 tiles over 28 days of GA4 events | Hourly, 14 hours a day | 10.5 GB | 44.5 | $278 |
| Forecasting feature build: 2 years of POS, 1 year of inventory, 90 days of events | Nightly | 132 GB | 4.0 | $25 |
| Analysts | Ad hoc | 10.0 | $62 |
We assume each dashboard query reads a quarter of the event columns. With the free TiB taken off and storage added, the month is $372. The forecasting job reads the most data per run and costs the least, because it runs once a day. The dashboard reads less per run and costs eleven times more, because it runs 4,340 times.
GA4 dashboards pay for every refresh, because BigQuery never caches them
A dashboard refreshing the same query every hour looks like a job for the query cache. BigQuery does not charge for cached results: "you are not charged for the query". But its list of exceptions covers exactly how retail teams query GA4. Results are not cached "If you are querying multiple tables using a wildcard", and GA4 data is read as events_*, one table per day.
Every refresh of a GA4 dashboard is billed in full. On data that changes once a day, an hourly tile open 14 hours pays for 14 scans of the same answer.
December's extra data adds $88; the peak schedules add $2,228
US e-commerce sales in December 2025 were $139,317 million against a 2025 monthly average of $106,541 million, not seasonally adjusted: 31% above an average month. Clothing stores peaked harder, at $39,105 million against an average of $24,991 million, 56% above. Sales dollars are a proxy for rows: treat these ratios as the shape of the season, since they do not measure your traffic.
Scale the events by 1.31 and keep every schedule as it was: December costs $460, 24% more than an average month. Now add three changes a retail team might make for the season (our assumptions):
- The trading dashboard refreshes every 15 minutes instead of hourly: 17,360 refreshes, $1,457.
- A war room dashboard, 8 tiles comparing today to the last 7 days, refreshes every 5 minutes for 16 hours a day: 47,616 refreshes, $999.
- The forecasting build runs every 4 hours for replenishment: 186 runs, $162.
December comes to $2,688, 7.2 times an average month, on 31% more data.
The peak also changes how data arrives. Google caps the daily GA4 export for standard properties: "Standard Google Analytics properties have a BigQuery Export limit of 1 million events for Daily (batch) exports." At 1.18 million events a day, our retailer is over it, and "If your property consistently exceeds the export limit, the daily BigQuery export will be paused". "There is no limit on the number of events for Streaming export", which costs "$0.05 per gigabyte of data": about $3 for December here. The ingestion line stays small; the reads are the bill.
Orders follow the same curve. If Shopify data reaches the warehouse through Fivetran's Shopify connector, Fivetran bills "the number of distinct rows synced from the source system to your destination system in a given calendar month", so a month with more orders bills more rows.
The bill stays up in January because nobody owns the schedule
January 2025 e-commerce sales were $96,073 million, 10% below the monthly average. Run the model on January's volume with the peak schedules still on and the month costs $1,903. Revert them and it costs $344.
The $1,559 difference is the peak, paid again every month nobody reverts it. At January volumes that is about $15,600 over the ten months to the next November, three and a half times what the base schedules cost in a whole year ($4,464).
Each change made sense on its own date and none of them carries an end date:
- Refresh intervals live in the BI tool, set by whoever ran the trading desk in November.
- The war room dashboard has no owner after the season, so it refreshes for an empty room.
- The forecasting schedule lives in the orchestrator, and the replenishment team may not know it doubles as a cost setting.
- Tables built for the peak, promo results at full event grain or Black Friday copies, are cheap to keep, and their rebuild jobs run on the compute line.
Measure cost per schedule and find what nobody reads after January
INFORMATION_SCHEMA.JOBS keeps 180 days of job history, so in late January it still holds the whole peak. query_info.query_hashes.normalized_literals is a hash that "ignores comments, parameter values, UDFs, and literals", which groups the refreshes of one dashboard tile even when the date literal changes. The hash is only set on runs that are not cache hits, so this query counts and prices billed runs per month:
SELECT DATE_TRUNC(DATE(creation_time), MONTH) AS month,
       query_info.query_hashes.normalized_literals AS query_hash,
       ANY_VALUE(user_email) AS run_by,
       COUNT(*) AS billed_runs,
       SUM(total_bytes_billed) / POW(1024, 4) * 6.25 AS on_demand_usd
FROM `region-us`.INFORMATION_SCHEMA.JOBS
WHERE creation_time >= TIMESTAMP_SUB(CURRENT_TIMESTAMP(), INTERVAL 180 DAY)
  AND job_type = 'QUERY'
  AND state = 'DONE'
  AND query_info.query_hashes.normalized_literals IS NOT NULL
GROUP BY month, query_hash
ORDER BY on_demand_usd DESC
LIMIT 50;
A hash whose run count jumped in November and never came down is a peak schedule still running. A tile that refreshes hourly and shows about 24 billed runs a day never reaches the cache; on GA4 data that usually means a wildcard table.
Then find the tables nobody reads. referenced_tables lists every table a query read, and is "Only populated for query jobs that are not cache hits", so this undercounts reads served from the cache:
SELECT t.dataset_id, t.table_id,
       MAX(j.creation_time) AS last_read,
       COUNT(*) AS reads_last_90_days
FROM `region-us`.INFORMATION_SCHEMA.JOBS AS j,
     UNNEST(j.referenced_tables) AS t
WHERE j.creation_time >= TIMESTAMP_SUB(CURRENT_TIMESTAMP(), INTERVAL 90 DAY)
  AND j.job_type = 'QUERY'
GROUP BY 1, 2
ORDER BY last_read;
Tables missing from the result had no billed read in 90 days. Compare the result with your datasets' table list, then check what still writes to the missing ones. Per-user and per-label attribution is in BigQuery on-demand vs editions.
Point dashboards at a daily aggregate and the refresh bill drops to a few dollars
Reverting schedules saves the leftover; one change saves most of the peak too. Build a daily aggregate from yesterday's events once a night, one scan of about 0.5 GB, and point the trading dashboard at it. A single table that changes once a day is no longer a wildcard, so identical refreshes can come from the cache. Even billed in full, BigQuery charges "a minimum 10 MB data processed per table referenced by the query": 17,360 refreshes of a 30 MB aggregate read 0.5 TiB, about $3, against $1,457 on the raw events. Keep the raw events_intraday_ table only for the tiles that need the last hour.
The objection: $2,700 is noise next to holiday revenue
It is, in December. No retailer should slow down a Black Friday war room to save $1,000, and the model agrees: the peak month is the one month the schedules earn their cost. The case for acting is the other ten months. The leftover costs three and a half times the base schedules' annual bill, and it buys nothing.
A second objection: switch to BigQuery editions and cap the slots. Editions bill "query processing capacity, measured in slots (virtual CPUs) over time" instead of bytes, and the break-even between the two models is worth computing. But a 5-minute refresh still uses those slots all year: it either takes them from analysts or adds autoscaled slot-hours to the bill.
What this model does not tell you
- It is list price for Iowa, read on October 28, 2026, with no discounts or commitments.
- Every volume and schedule is an assumption, chosen to be plausible for a mid-size retailer; the per-event size is Google's approximation, and the model treats GB and GiB as equal.
- Census sales are dollars, not rows. Traffic can peak harder than revenue, during promotions especially.
- BI Engine, BI extracts and connector costs are left out, and so are the people who run the platform, which data warehouse cost shows is usually the largest line.
- A larger retailer scales the numbers and keeps the shape. More events raise every row; the ratio between base and peak schedules comes from the schedules.
Where Datapace fits
The peak leftover hides in three tools: a refresh interval in the BI tool, a schedule in the orchestrator and a table in the warehouse, each in its own bill. Datapace is building one map of your data estate with usage and cost attached, and agents that propose changes as pull requests your team reviews and merges. Before the next peak, run the two queries above in January and compare December's run counts with February's; for the BigQuery side in depth, read BigQuery on-demand vs editions.
Sources
- U.S. Census Bureau, Monthly Retail Trade, estimates of monthly retail and food services sales by kind of business, 2025, not adjusted (NAICS 4541 electronic shopping and mail-order houses; NAICS 448 clothing and clothing accessories stores).
- Google Cloud, BigQuery pricing (on-demand compute, storage, minimum bytes billed).
- Google Cloud, Using cached query results.
- Google Cloud, INFORMATION_SCHEMA.JOBS view.
- Google Analytics Help, BigQuery Export (table names, streaming export cost, events per gigabyte).
- Google Analytics Help, Set up BigQuery Export (daily export limit for standard properties).
- Fivetran, Usage-based pricing (Monthly Active Rows) and Shopify connector.