TL;DR. Data valorization is the work of converting stored data into consumed value: decisions, product behavior, and now agent actions. Most published definitions describe the outcome and skip the work. This one is operational: value is realized at read time, so the measurable starting point is the share of your estate that is never read at all. On a synthetic 24-table Postgres schema modeled on a mid-size application, one simulated week of workload left 14 tables, a third of stored bytes, without a single read. PostgreSQL 16 can put that number on your real database in one query. What it cannot measure is the second axis, whether the data that is read is actually understood, and that axis is where valorization work lives.
Search for data valorization and the results split into two camps: academic value-creation frameworks and consultancy service pages offering to "unlock the value of your data." Both describe an outcome. Neither tells a data team what to do on Monday. That gap matters because the term is not going away: it is the word European organizations in particular reach for when the question is "we store all of this, what is it actually doing for us," and it deserves an answer more precise than a services engagement.
This post proposes a working definition, then makes it measurable on PostgreSQL, because a definition you cannot measure against is a slogan.
Most definitions name the outcome, not the work
The circulating definitions agree on the outcome: raw data becomes strategic insight, decisions improve, a competitive edge appears. As a description of the end state, fine. As guidance, empty, for the same reason "software quality is the absence of defects" does not tell you how to test.
The tell is what the definitions leave out. None of them mention the estate you already have. They describe a pipeline from "raw data" to "insight" as if the raw data were arriving fresh, when the actual starting condition of every team past its second year is hundreds of tables of accumulated history: live application tables, reporting tables, and a sediment layer of staging copies, pre-migration backups, one-off exports, and abandoned feature tables. Valorization that ignores the sediment is not valorization, it is adding one more pipeline on top of it.
So here is the working definition. Data valorization is the work of raising the share of your stored data that is read, correctly understood, and acted on by its consumers. Three clauses, three failure modes: data nobody reads, data that is read but misread, and data that is read and understood but feeds nothing. Everything a data team does under this heading, from deleting dead tables to documenting semantics to serving context to AI agents, moves data along one of those three clauses.
Value is realized at read time
The definition puts the value event at consumption, not at collection, and that placement does the real work. A table produces no value by existing. It produces value the moment a query against it changes something downstream: a decision, a rendered page, a model feature, an agent's next action. Storage is a cost the whole time; the reads are when the asset pays.
That framing sounds obvious and has an immediate, slightly uncomfortable consequence: the parts of your estate that are never read have a realized value of zero, whatever their theoretical value. Not low. Zero, ongoing, while they keep costing storage, backup window, migration effort, and attack surface. Every valorization initiative should therefore open with the negative-space question, because it is the only part of the problem the database will answer for you directly.
Start by measuring what is never read
PostgreSQL keeps per-table read counters in pg_stat_user_tables: seq_scan and idx_scan accumulate since the last statistics reset, and PostgreSQL 16 adds last_seq_scan and last_idx_scan timestamps, so you no longer need counter deltas to know recency. The audit is one query:
with t as (
  select relname,
         coalesce(seq_scan, 0) + coalesce(idx_scan, 0) as reads,
         greatest(last_seq_scan, last_idx_scan)        as last_read,
         pg_total_relation_size(relid)                 as bytes
  from pg_stat_user_tables
)
select count(*) filter (where reads = 0)                     as never_read_tables,
       count(*)                                              as total_tables,
       pg_size_pretty(sum(bytes) filter (where reads = 0))   as never_read_bytes,
       round(100.0 * sum(bytes) filter (where reads = 0)
                   / sum(bytes), 1)                          as pct_bytes_never_read
from t;
To put an illustrative number on it, we built a synthetic 24-table schema modeled on a mid-size application: eight live application tables (customers, orders, order items, payments, sessions, events and so on), reporting tables, and the sediment every real database accumulates, staging copies, a pre-migration orders backup, finance exports, two legacy tables, and three abandoned-feature tables. We reset statistics, ran a simulated week of application and nightly reporting queries against the live surface, then ran the audit. The result: 14 of 24 tables had zero reads, holding 94 MB of 281 MB, 33.6 percent of stored bytes. The never-read list was exactly the sediment: legacy_invoices at the top, then the staging copies, the backup, the exports, and the abandoned features.
The number is synthetic and the shape is not. The sediment classes in the demo are the ones that accumulate in any schema old enough to have survived a migration, and on production databases the unread share has had years to grow rather than one simulated week. Run the query on your own primary and you will get your own number in seconds.
Three caveats before you act on it. Statistics are per instance, so reads served by a replica accumulate on the replica, not the primary; audit every instance that serves queries. The counters run since the last reset, so check stats_reset in pg_stat_database before trusting a zero. And if you do reset to get a clean window, the documentation warns that resetting can cause autovacuum to skip necessary work, so follow it with a database-wide ANALYZE.
Reads are necessary, not sufficient
If the unread share were the whole story, valorization would be a cleanup job. The harder half sits on a second axis the database does not measure: whether the data that is read is understood by whoever reads it.
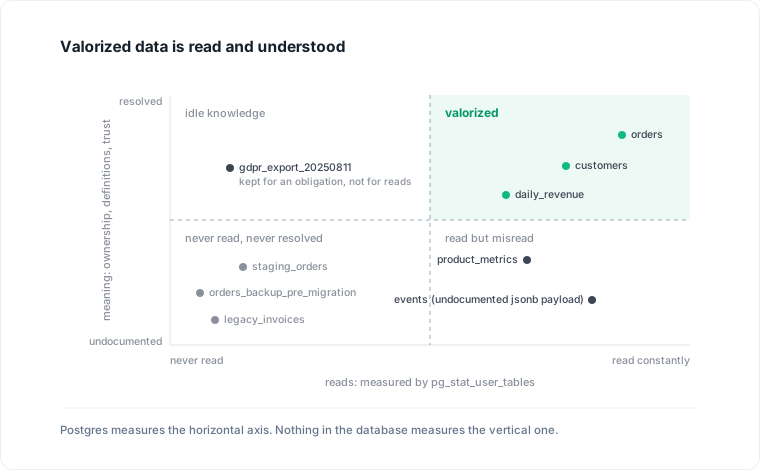
Every table in the audit sits somewhere on this plane, and the read axis alone misclassifies both interesting quadrants. A compliance retention table with zero reads is not waste, it is idle knowledge held against a future obligation; deleting it because the counter is zero would be the audit misfiring. And a hot table is not automatically valorized: an events table with an undocumented jsonb payload gets read constantly and understood by exactly the two engineers who remember which kind values were deprecated. Consumption without shared meaning produces dashboards that disagree, metrics nobody trusts, and eventually decisions made against numbers that meant something else.
Unread is measurable. Misread is not, and misread is where the expensive failures live.
The meaning axis is also where the work stops being a query and starts being an investigation. What does this status value actually mean, which of these three revenue columns is the one finance closes on, why do two tables both claim to be the customer master: answering those requires reverse-engineering the undocumented parts of the schema and then keeping the answers alive, which is a harder problem than producing them once, as we argued in the case for documentation that stays current. A team that resolves meaning for its twenty most-read tables has done more valorization than one that builds a new pipeline on top of the unresolved two hundred.
Agents move consumption to the meaning axis
The reason to take the definition seriously now, rather than as background hygiene, is that the consumer population is changing. Human analysts hedge: faced with an ambiguous column they ask in Slack, cross-check a dashboard, or quietly exclude the field. AI agents given database access do none of that by default. They read whatever they can reach, interpret it literally, and compose answers at a speed that outruns review.
That shifts where valorization pays. For a human consumer, unresolved meaning costs time. For an agent it silently converts the second quadrant, read but misread, into confident wrong actions. The same shift is visible across the tooling market: the platforms that used to call themselves data catalogs now position themselves as context layers, precisely because schemas plus lineage plus resolved definitions turn out to be what agents need before their reads can be trusted. In the terms of this post, serving context is valorization work on the meaning axis, done so that machine consumption lands in the right quadrant.
Where Datapace fits
The two-axis picture is the problem Datapace is being built against. Datapace is building the context layer between your databases and your AI: resolved schema meaning validated by the people who own the data, workload evidence beside it on the same graph, and governed execution for what an agent may do and access, served over MCP. In this post's terms, that is the meaning axis made explicit and queryable, so that what an agent reads arrives already resolved rather than raw. It is not a silver bullet: no tool resolves meaning by itself, because the ground truth lives with the people who own the data; what a context layer changes is whether their answers accumulate somewhere every consumer, human or agent, actually reads. If your estate's unread share or your agents' misread risk is a number you want to see, book a call.
The audit above costs ten minutes on any PostgreSQL 16 database. The number it returns is rarely flattering and always useful: it converts data valorization from an aspiration into a baseline, and baselines are what work starts from.
Sources
- PostgreSQL 16 documentation, The Cumulative Statistics System (pg_stat_user_tables columns including last_seq_scan and last_idx_scan; the autovacuum warning on resetting counters), verified against the project's own repository copy of monitoring.sgml.
- Local measurement: synthetic 24-table schema and simulated one-week workload on PostgreSQL 16.13, audit query as printed above (14 of 24 tables never read; 94 MB of 281 MB, 33.6 percent of bytes).