TL;DR. Snowflake warehouse size sets the credit rate: on Gen1, 1 credit an hour for an X-Small, doubling at each step to 512 for a 6X-Large. The next size up costs less only if the query finishes in under half the time. For a job that runs alone, add the idle minutes before auto-suspend, which bill at the bigger rate too. With the default 600 seconds, a join GitLab measured as 29% cheaper on X-Large costs 2% more per run.
Snowflake warehouse size decides how many credits a running warehouse burns per second. The usual sizing advice compares run time against the doubled rate, which is right for a warehouse that stays busy. For a job that runs alone, it misses the idle tail: the minutes a warehouse waits before it suspends, billed at whatever size you picked. The test below adds the tail back, using run times from GitLab's public data team handbook.
Snowflake warehouse sizes and credits per hour: each step doubles the rate
| Size | Gen1 credits per hour | Gen2, AWS and GCP | Gen2, Azure |
|---|---|---|---|
| X-Small | 1 | 1.35 | 1.25 |
| Small | 2 | 2.7 | 2.5 |
| Medium | 4 | 5.4 | 5 |
| Large | 8 | 10.8 | 10 |
| X-Large | 16 | 21.6 | 20 |
| 2X-Large | 32 | 43.2 | 40 |
| 3X-Large | 64 | 86.4 | 80 |
| 4X-Large | 128 | 172.8 | 160 |
| 5X-Large | 256 | not offered | not offered |
| 6X-Large | 512 | not offered | not offered |
Gen1 rates come from Snowflake's overview of warehouses, Gen2 rates from Table 1(b) of the Service Consumption Table (effective October 29, 2026). The Gen2 page states that Gen2 "aren't available for warehouse sizes X5LARGE and X6LARGE", and the overview lists those two sizes as generally available in AWS and Azure regions.
Billing is per second, "with a 60-second minimum each time the warehouse starts". Resizing up bills the added compute from the moment of the resize, per Snowflake's warehouse considerations. CREATE WAREHOUSE defaults to XSMALL and lists the generation default as '2', and the Gen2 page adds "unless Gen2 isn't available in your region". The overview page still says Gen2 "currently are not the default". Run SHOW WAREHOUSES and read the resource_constraint column before you price anything; Redshift vs Snowflake shows how far Gen2 moves the hourly rate.
When a bigger warehouse costs less: the query must finish in under half the time
Credits per run are seconds times the rate. One size up doubles the rate, so the bigger warehouse wins only if the query takes less than half as long. Snowflake says queries scale "linearly with respect to warehouse size, particularly for larger, more complex queries", and also that "larger is not necessarily faster" for small ones. The only way to know which kind you have is to time it.
GitLab's data team published that test in its Snowflake warehouse optimization handbook page, with query IDs for the first query. Converted to credits at Gen1 rates:
| Query | Size | Run time | Credits per run |
|---|---|---|---|
| Deduplicate one table, 630 partitions | X-Small | 7m14s (434 s) | 434 × 1 / 3,600 = 0.121 |
| Medium | 1m45s (105 s) | 105 × 4 / 3,600 = 0.117 | |
| Large | 1m23s (83 s) | 83 × 8 / 3,600 = 0.184 | |
| Five-table join, 9,211 partitions | Large | 32m17s (1,937 s) | 1,937 × 8 / 3,600 = 4.304 |
| X-Large | 11m32s (692 s) | 692 × 16 / 3,600 = 3.076 |
Medium beat X-Small by 3% at four times the rate, because the run time fell 76%. Large then cost 58% more than Medium for a 21% faster run. The join got 29% cheaper on X-Large. GitLab reports no spill data, so the cause is not known; memory is where we would look first, since Snowflake's spillage guide says performance "degrades drastically" when a query spills to local disk, and worse when it spills to remote storage.
The idle tail flips the verdict for jobs that run alone
After the last query, a warehouse keeps running until AUTO_SUSPEND expires, 600 seconds by default. Run GitLab's queries once on a warehouse with nothing else on it, and each run also pays 600 seconds at its size's rate.
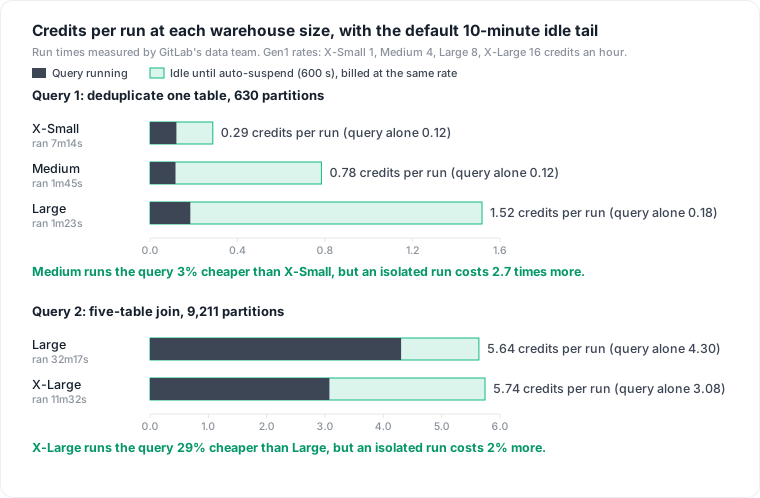
With a tail of T seconds, the next size up is cheaper per isolated run only if its run time is under (t − T) / 2, where t is the run time on the smaller size. For the join, (1,937 − 600) / 2 = 668.5 seconds; X-Large took 692. At 5.74 credits against 5.64, the bigger size missed by 23.5 seconds. For the deduplication, t is 434 seconds, less than the tail, so nothing beats X-Small for a lone run. With AUTO_SUSPEND = 60 the join's threshold rises to 938.5 seconds, and X-Large wins again: 3.34 credits against 4.44.
The strongest objection is Snowflake's own: "Don't focus on warehouse size", since per-second billing lets you run big and suspend. On a busy warehouse that holds, because the next query uses the idle seconds. GitLab's test leaves the tail out, which fits production dbt jobs that run many models in a row on its Large and X-Large warehouses. The tail bites on a nightly job with its own warehouse, an hourly task, or an analyst's one-off query. You can tell which case you are in: WAREHOUSE_METERING_HISTORY gives compute credits used and credits attributed to queries per hour, and the gap is idle time, as the Snowflake cost optimization queries show.
Queuing calls for more clusters, not a bigger size
If QUEUED_OVERLOAD_TIME in QUERY_HISTORY is high, resizing is the weaker lever: Snowflake says it can reduce queuing but "is not intended for handling concurrency issues". A multi-cluster warehouse (Enterprise Edition) adds clusters of the same size and bills each one while it runs.
How to test the right size in four steps
- Pick the queries that cost the most. GitLab found that right-sizing its smallest models "does NOT lead to significant cost-savings". Rank recurring queries by credits in QUERY_ATTRIBUTION_HISTORY, which skips queries of about 100 ms or less and keeps Query Acceleration credits in a separate column:
SELECT a.query_parameterized_hash,
       a.warehouse_name,
       COUNT(*)                          AS runs_30d,
       SUM(a.credits_attributed_compute) AS credits_30d
FROM   snowflake.account_usage.query_attribution_history a
WHERE  a.start_time > CURRENT_DATE() - 30
GROUP  BY 1, 2
ORDER  BY credits_30d DESC
LIMIT  10;
Run each at two sizes, the way production runs it. Use a test warehouse with a pinned generation, set
ALTER SESSION SET USE_CACHED_RESULT = FALSE, and run the real statement: GitLab notes that a dbt model also runs aMERGEorCREATE TABLE, which belongs in the benchmark.Compute credits per run, then add your real tail. Tag the test runs with
QUERY_TAGand join the two views onquery_id.QUERY_HISTORYgives the size andexecution_timein milliseconds;QUERY_ATTRIBUTION_HISTORYgives the credits, after up to 8 hours:
SELECT q.warehouse_size,
       q.execution_time / 1000      AS seconds,
       a.credits_attributed_compute AS credits
FROM   snowflake.account_usage.query_history q
JOIN   snowflake.account_usage.query_attribution_history a
       ON a.query_id = q.query_id
WHERE  q.query_tag = 'sizing-test'
ORDER  BY q.start_time;
If production runs the job alone, add AUTO_SUSPEND seconds times the size's credits per hour, divided by 3,600, to each row.
- Keep the cheaper size, or price the speed. GitLab accepts the next size up only when the run time drops 40% or more, which caps the extra cost at 20%. Write down your own rule.
Auto-suspend and resource monitors: what each one caps
Keep AUTO_SUSPEND short, but not below the regular gap between queries. Snowflake recommends "5 or 10 minutes or less", but warns that with regular gaps of 2 or 3 minutes a 1 or 2 minute value keeps the warehouse "in a continual state of suspending and resuming", each resume billed at least 60 seconds. Suspending also drops the warehouse cache. For the isolated join above, a 60-second tail takes the X-Large run from 5.74 to 3.34 credits.
A resource monitor caps warehouse credits per interval, loosely. It counts warehouse credits plus the cloud services behind them, ignoring the 10% cloud services adjustment, so it can trip on credits you are never billed. Suspend "waits for currently executing queries to finish", and even Suspend Immediate may take time, so Snowflake suggests triggering at 90% instead of 100%.
What it does not cap: serverless. Snowflake says "you can't use a resource monitor to track spending associated with serverless features and AI services". Query Acceleration, an Enterprise Edition feature, is billed like other serverless features, per the QAS documentation. CREATE WAREHOUSE lists it as on by default for standard warehouses, Gen1 and Gen2, and a new Gen2 warehouse gets a maximum scale factor of 8. That scale factor multiplies the warehouse's size: Snowflake's example is a Medium at factor 5 adding "up to an additional 20 credits per hour". A resource monitor does not track that spend; Snowflake points to a budget for it.
The limits of this method: GitLab's numbers are two queries at one company, with one timing per size, and GitLab does not say which generation it ran. We did not rerun them. The tail model assumes nothing else uses the warehouse before it suspends.
Datapace is building one map of your data estate with usage and cost attached, and agents that propose changes as pull requests your team reviews and merges. Per-warehouse query history next to its credits is what a sizing test needs. To find the warehouses worth testing first, start with the queries in Snowflake cost optimization, and see where warehouse compute sits in the whole bill in data warehouse cost.