TL;DR. AWS IoT SiteWise pricing bills each data point three times: as a message on the way in, as stored gigabytes every month, and as a message again when someone reads it. For a hypothetical plant with 2,000 data streams read once a second, ingestion costs $778 a month if the gateway sends 10 values per stream per entry, or $7,776 if it sends one. Then storage takes over: SiteWise keeps data in its hot tier indefinitely unless you set a retention period, and at $0.30 per GB-month that line passes ingestion in month 6 and reaches $5,802 by month 36. A 30-day hot retention with the warm tier holds the same data for $727.
AWS IoT SiteWise pricing has no fixed fee: you pay per message, per computation and per gigabyte stored. Two settings decide most of the bill. The first is how many values your gateway packs into each message. The second is the hot tier retention period, which is unset by default.
Below, one plant priced from AWS's list prices for US East (N. Virginia), read from the AWS Price List API on October 28, 2026. It is a worked model, not a measured benchmark: no plant ran.
SiteWise bills messages, computations and stored gigabytes
| Dimension | US East list price | What counts |
|---|---|---|
| Messages (in and out) | $1.00 per million | Ingested data, computed data, query results |
| Computations | $0.50 per million | Transforms, metrics and automatic aggregates |
| Hot storage | $0.00041667 per GB-hour ($0.30 per GB-month) | SiteWise's managed time series store |
| Warm storage | $0.000041667 per GB-hour ($0.03 per GB-month) | Managed tier for history |
| Cold tier export | $0.005 per thousand objects | Objects written to your own S3 bucket |
| Query | $0.20 per GB scanned | Data scanned by queries, in 100 KB increments |
| SiteWise Monitor | $10 per active user per month | Managed dashboards |
| SiteWise Edge | Collection free; processing $200 per active gateway per month | On-site gateway packs |
Sources: the Price List API and the SiteWise pricing page. Anomaly detection, the SiteWise Assistant and Scenario Discovery are billed separately and left out here.
The metering rules matter more than the rates. From the pricing page:
- Near real-time ingestion is "metered in 1KB increments or 10 data points per data stream."
- Buffered ingestion is "metered in 5KB increments or 60 data points across multiple data streams," with "a minimum of 10MB or 2,000 messages per ingestion period."
- Reads are messages too. Query results are metered "for each set of up to 50 property values or every 4 KB of data," and warm tier reads meter "a minimum of 200 KB or 10 messages per retrieval per data stream."
- Aggregates are computed for you. SiteWise computes average, count, maximum, minimum, standard deviation and sum "every minute, hour, and day" for each property, and AWS's pricing examples bill one computation per ingested message.
The same plant costs $7,776 or $778 a month to ingest
Consider a hypothetical plant with 200 machines and 10 measurements each (temperatures, pressures, motor currents): 2,000 data streams read once a second, 100 bytes per data point, the size AWS uses in its own Example 9. That is 2,000 x 86,400 x 30 = 5.184 billion data points a month.
| Gateway design | Messages a month | Messages | Computations | Per month |
|---|---|---|---|---|
| One value per entry | 5,184 million | $5,184.00 | $2,592.00 | $7,776.00 |
| 10 values per stream per entry | 518.4 million | $518.40 | $259.20 | $777.60 |
| Buffered, 50 values per 5 KB message | 103.68 million | $103.68 | see below | $103.68 + |
The first row is how AWS's own Example 1 meters a 1 Hz measurement: one message per second per measurement. The BatchPutAssetPropertyValue API accepts "up to 10 entries per request" and "up to 10 property values (TQV data points) per entry," so a gateway that holds each stream's values for 10 seconds fills one 1 KB message per entry.
Packing 10 values per entry cuts ingestion tenfold and costs 10 seconds of latency. The buffered path goes further: a SiteWise Edge gateway writes Parquet files to S3 "at a configured frequency" and imports them, per the buffered destination guide. In AWS's Example 9, buffered data carries no computation charge, but it arrives minutes late. Use it for the streams nobody watches live.
After ingestion, the hot tier becomes the bill
At 100 bytes a point, the plant writes 482.8 GB of raw data a month (AWS's examples divide by 1024 cubed). Aggregates add more. AWS's Example 9 estimates 3,099.63 GB of aggregates a month for 100,000 streams, about 0.031 GB per stream, which gives this plant about 62.0 GB. Total: 544.8 GB added every month.
Now the default. The storage guide says data lands in the hot tier, and "if a retention period is not set, your data is stored indefinitely in the hot tier." AWS bills the average data held during the month, so with nothing set:
| Month | Data held, average | Hot tier, no retention | Hot 30 days, then warm |
|---|---|---|---|
| 1 | 272 GB | $81.72 | $81.72 |
| 6 | 2,996 GB | $898.90 | $236.98 |
| 12 | 6,265 GB | $1,879.53 | $335.05 |
| 36 | 19,340 GB | $5,802.02 | $727.29 |
The tiered column keeps one month (544.8 GB, $163.44) in hot and everything older in warm at $0.03. Nothing is deleted.
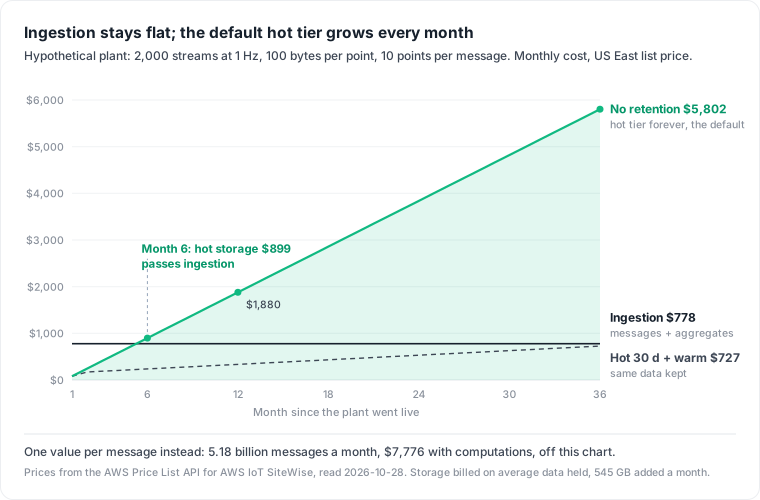
Ingestion is flat; storage compounds. By month 36 the default plant pays $6,580 a month, and 88% of it is hot storage. Three habits make the line steeper than this model:
- High-frequency streams nobody reads. A tank temperature that moves over minutes, sent once a second, is 60 times the points of a one-minute value, in messages, computations and gigabytes.
- Hot retention left unset. The hot tier costs 10 times the warm tier and about 13 times S3 Standard at $0.023 per GB.
- The same signal stored twice. If the plant keeps its on-site historian, every stream is billed once in the historian's license and servers and again in SiteWise. Unless someone decides which copy is the record, both keep growing.
Cut the bill in three settings: the entry, the retention, the dashboard
Pack values per entry. Ten values per stream per entry is the difference between $7,776 and $778 a month here. Move streams that tolerate delay to the buffered destination.
Set hot retention and opt in to warm. The configuration guide shows the call, with hot retention of at least 30 days:
{
  "storageType": "SITEWISE_DEFAULT_STORAGE",
  "disassociatedDataStorage": "ENABLED",
  "warmTier": "ENABLED",
  "retentionPeriod": { "numberOfDays": 30 }
}
aws iotsitewise put-storage-configuration --cli-input-json file://storage.json
Read the current settings first with aws iotsitewise describe-storage-configuration, so you do not override a cold tier. Two rules from the same guide: "to set hot tier retention, you must have either warm or cold tier storage," and a shorter retention moves data "permanently" out of hot, while a longer one only applies to new data.
The cold tier is the other option: an S3 bucket in your account, written "every 6 hours." At S3 Standard prices it holds this plant's month-36 history for about $596 including the hot month, plus $1.20 a month of export objects and S3 request charges. Reads from it are slow, so it suits reports and backups.
Point dashboards at aggregates. AWS's Examples 4 and 5 meter a one-hour graph of raw 1 Hz data at 72 messages per refresh, against 2 for one-minute aggregates. Refreshed every 5 seconds around the clock, that is about $37.32 a month per raw graph and $1.04 per aggregate graph. Small per graph; a wall of them is not.
Measure per-stream volume and readers before you cut
The bill shows usage types, not streams. Start there, grouped by usage type (USE1-AWSIoTSiteWise-Messaging, -Computations, -Storage, -StorageWarm in the price list), with Cost Explorer:
aws ce get-cost-and-usage --time-period Start=2026-09-01,End=2026-10-01 \
  --granularity MONTHLY --metrics UnblendedCost \
  --filter '{"Dimensions":{"Key":"SERVICE","Values":["AWS IoT SiteWise"]}}' \
  --group-by Type=DIMENSION,Key=USAGE_TYPE
If Storage is growing month over month and describe-storage-configuration shows no retentionPeriod, you are on the default.
Then count points per stream. The COUNT aggregate of GetAssetPropertyAggregates returns data points per day:
aws iotsitewise get-asset-property-aggregates \
  --property-alias /plant1/line3/press7/temperature \
  --aggregate-types COUNT --resolution 1d \
  --start-date 2026-10-01T00:00:00Z --end-date 2026-10-28T00:00:00Z
Last, find who reads which stream. SiteWise reads such as GetAssetPropertyValueHistory and GetAssetPropertyAggregates are CloudTrail data events, off by default and billed at $0.10 per 100,000. Log only reads:
aws cloudtrail put-event-selectors --trail-name sitewise-reads \
  --advanced-event-selectors '[
    {"Name":"Asset reads","FieldSelectors":[
      {"Field":"eventCategory","Equals":["Data"]},
      {"Field":"resources.type","Equals":["AWS::IoTSiteWise::Asset"]},
      {"Field":"readOnly","Equals":["true"]}]},
    {"Name":"Stream reads","FieldSelectors":[
      {"Field":"eventCategory","Equals":["Data"]},
      {"Field":"resources.type","Equals":["AWS::IoTSiteWise::TimeSeries"]},
      {"Field":"readOnly","Equals":["true"]}]}]'
Both resource types are needed: AWS logs Asset when the request names an asset ID and TimeSeries otherwise. A month of these events, grouped by caller and stream, tells you which 1 Hz streams have a reader and which only have a writer.
The objection: hot storage is fast, and storage is cheap
The strongest case against this: the hot tier answers dashboards and alarms quickly, warm reads have a 200 KB minimum per stream, and a few thousand dollars is small next to an hour of downtime.
Part of it holds. Keep the recent window hot, sized to how far back your dashboards and alarms actually look; AWS itself advises setting hot retention "longer than the time taken to retrieve data often." The money is in where old data sits, not in whether you keep it. AWS's own guide recommends storing "long term data in the warm tier." And a heavy warm read pattern is something the CloudTrail log above will show before you change anything.
What this model does not tell you
- List price, read October 28, 2026, US East. Other regions and private pricing change every row.
- The plant is hypothetical. Stream counts, sample rates and point sizes vary by line; 100 bytes per point is AWS's Example 9 assumption.
- Aggregate storage is estimated from AWS's Example 9 ratio. Your figure depends on how many intervals have data.
- Not priced: custom metrics and transforms, alarms through AWS IoT Events, AWS IoT Greengrass on the gateway, AWS IoT Core if devices publish through it, and your historian's own cost.
For Azure's equivalent, see Azure IoT Hub pricing. For the trend behind these numbers, see the Industry 4.0 data explosion, and for the waste nobody owns across a platform, cloud waste in data infrastructure.
Where Datapace fits
A plant's equipment data is billed in a gateway, a SiteWise account, an S3 bucket and often an on-site historian, and none of them says which streams anyone reads. Datapace is building one map of your data estate (databases, warehouses, pipelines and what consumes them) with usage and cost attached, and agents that propose changes as pull requests your team reviews and merges. If the data leaves SiteWise for a lake or warehouse, start with data pipeline cost.
Sources
- AWS, AWS IoT SiteWise pricing and Price List API for AWS IoT SiteWise, Amazon S3 and AWS CloudTrail, US East.
- AWS IoT SiteWise User Guide, Manage data storage, Configure storage settings, Query asset property aggregates, BatchPutAssetPropertyValue API, Buffered destination using Amazon S3 and Logging with CloudTrail.
- AWS IoT SiteWise API Reference, GetAssetPropertyAggregates.
- AWS CLI Reference, get-cost-and-usage.