TL;DR. AWS Timestream pricing for a plant is decided mostly by how often people look at the data. Take a hypothetical plant writing 2,000 sensor values a second to Timestream for LiveAnalytics. Batched writes cost $57.82 a month and 12 hours of memory store $50.41. Screens sending up to 7 queries every 10 seconds keep 4 compute units busy around the clock: $1,512.56, 93% of the bill. The same screens refreshing every 5 minutes cost $151.26. New customers cannot open LiveAnalytics any more, and on Timestream for InfluxDB the instance bills every hour whether or not anyone reads.
AWS Timestream pricing covers two products with opposite meters. Timestream for LiveAnalytics bills per write, per GB stored and per second of query compute. Timestream for InfluxDB bills an instance by the hour and its storage by the GB, like a managed database. Which one you are on decides which lever matters.
Below, one plant priced with the US East rates in the AWS Price List API (N. Virginia), read November 1, 2026, and the Timestream pricing page. It is a worked model: no plant ran.
LiveAnalytics has been closed to new customers since June 20, 2025
Check this first. AWS's availability notice says it decided "to close new customer access to Amazon Timestream for LiveAnalytics, effective 6/20/25." Existing customers keep their workloads and "may continue to add new users and linked accounts under that payer account." AWS recommends that new customers "evaluate Amazon Timestream for InfluxDB as an alternative."
So the LiveAnalytics sections below are for plants already on it. A plant starting now prices InfluxDB, further down.
LiveAnalytics bills four meters
| Meter | US East list price | What counts |
|---|---|---|
| Writes | $0.50 per million writes of 1 KiB | Each write request, counted in units of 1 KiB |
| Memory store | $0.036 per GB-hour | Recent data, fast point queries |
| Magnetic store | $0.03 per GB-month | Older data, billed for at least 100 GB per account per Region |
| Query compute | $0.518 per TCU-hour | Timestream compute units, 4 vCPU and 16 GB each |
Sources: the price list and the pricing page. TCUs "are on-demand and metered per second with a 30-second minimum."
One plant, 2,000 sensor values a second
Consider a hypothetical plant with 200 machines and 10 sensors each, read once a second: the same plant as our AWS IoT SiteWise pricing model. Each machine writes one multi-measure record a second. Under AWS's size rules (8 bytes of timestamp, UTF-8 bytes of every name and string value, 8 bytes per double), a record with dimensions line=line-03 and machine=press-017, measure name sensors and 10 doubles with 10-byte names is:
8 + 11 + 16 + 7 + 10 x (10 + 8) = 222 bytes.
That is 200 records a second, 0.160 GB an hour, 116.7 GB a month of 730 hours. Every figure below uses 730 hours, as most of AWS's own pricing examples do.
Batched writes cost $57.82 a month instead of $2,628
Writes are counted in units of 1 KiB, and AWS's own example counts an 83-byte event written alone as one whole write. WriteRecords takes up to 100 records per request.
| Write design | Writes billed a month | Per month |
|---|---|---|
| One single-measure value per request (53 bytes, one write) | 5,256 million | $2,628.00 |
| 100 multi-measure records per request (22,200 bytes, 22 KiB) | 115.6 million | $57.82 |
Batching is the first lever, and AWS's cost optimization guide lists it first. Multi-measure records also shrink storage: one 53-byte record per value stores 2.4 times the bytes of one 222-byte record per machine (106,000 against 44,400 bytes a second), because the timestamp and dimensions repeat for every value.
The memory store costs 876 times the magnetic store
At $0.036 per GB-hour, a GB held all month in the memory store costs $26.28. In the magnetic store it costs $0.03. For this plant, with multi-measure records:
| Memory store retention | Data held | Memory store per month |
|---|---|---|
| 12 hours | 1.92 GB | $50.41 |
| 7 days | 26.85 GB | $705.70 |
| 30 days | 115.08 GB | $3,024.43 |
With single-measure records, 7 days hold 64.11 GB and cost $1,684.78. The magnetic store, by contrast, bills the $3.00 minimum (100 GB) in the first month in both designs and reaches about 1,400 GB and $42.01 a month after a year with multi-measure records.
Why would anyone set 7 days? Late data. AWS defines late-arriving data as a timestamp "outside the memory store retention period," and the write guide says you "must explicitly enable" magnetic store writes to accept it. A plant gateway that buffers readings through a network outage and replays them later sends exactly that. Without magnetic store writes, a long memory retention is the workaround, and it is the most expensive one.
The fix is two settings on the table: a memory retention sized to your dashboards (the valid range is 1 to 8,766 hours) and EnableMagneticStoreWrites set to true, with an S3 location for rejected records. The update-table command takes both:
aws timestream-write update-table --database-name plant1 --table-name sensors \
  --retention-properties MemoryStoreRetentionPeriodInHours=12,MagneticStoreRetentionPeriodInDays=1825 \
  --magnetic-store-write-properties '{"EnableMagneticStoreWrites":true,
    "MagneticStoreRejectedDataLocation":{"S3Configuration":{"BucketName":"plant1-ts-rejects"}}}'
Once writes and retention are fixed, screens are 93% of the bill
Here the plant's bill changes character. Writes plus storage are now $111.23 a month. Query compute is not.
AWS's TCU guide bills each TCU "for a minimum of 30 seconds" and gives a rule of thumb: 7 concurrent queries need 4 TCUs. The same guide says that "to run queries, you must set the minimum capacity to 4 TCUs," and 4 is also the lowest MaxQueryTCU. An answer on an AWS re:Post thread applies it per query: "the minimum number of TCUs used for the query is 4 TCU." Taking that floor, one refresh of a screen with up to 7 panels costs at least 4 TCUs for 30 seconds: 0.0333 TCU-hours, or $0.0173. If screens refresh every 30 seconds or faster, those 4 TCUs never go idle.
| Screen refresh, 24 hours a day | Refreshes a month | Query compute per month |
|---|---|---|
| Every 10 seconds | 262,800 | $1,512.56 (4 TCUs never idle) |
| Every 30 seconds | 87,600 | $1,512.56 |
| Every minute | 43,800 | $756.28 |
| Every 5 minutes | 8,760 | $151.26 |
The one-minute row matches what a user on the same re:Post thread worked out for one query a minute: "~$750/month." AWS's own pricing example for a streaming service puts 7 queries a second at 4 TCUs around the clock for $1,512.56, 79% of its $1,912.84 total.
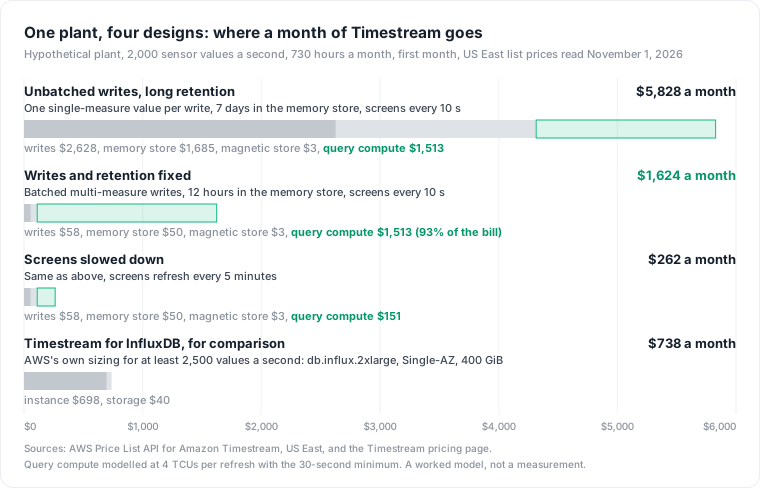
A shop-floor screen rarely needs a 10-second refresh of a one-hour window. Point it at a smaller, pre-aggregated table, refresh it at the pace the process changes, and turn it off between shifts: the same 10-second screens running 16 hours a day cost $1,008.37. Then set MaxQueryTCU, which defaults to 200, a little above your measured peak so a runaway dashboard cannot scale the bill for you.
On Timestream for InfluxDB, the instance bills whether anyone reads
New customers land here. The pricing page bills InfluxDB 2 "per DB instance-hour consumed from the time a database instance is launched until it is stopped or deleted," and storage per allocated GB. AWS's own example is close to this plant: over 5,000 UPS devices sending 5 fields every 10 seconds (at least 2,500 values a second), dashboards refreshing every 60 seconds and anomaly tasks every 10 seconds.
| AWS's sizing for that load | Instance | Storage, 400 GiB | Per month |
|---|---|---|---|
| Single-AZ, db.influx.2xlarge | $0.956 an hour, $697.88 | $0.10 per GB, $40.00 | $737.88 |
| Multi-AZ | $1.913 an hour, $1,396.49 | $0.20 per GB, $80.00 | $1,476.49 |
Reads stop being a line on the bill and become the instance size. A dashboard nobody opens costs nothing extra, and nothing comes back when you delete it, unless the load drops enough to move down an instance class. InfluxDB 3 on Timestream keeps data in shared object storage, billed at $0.023 per GB-month in the price list against $0.10 to $0.50 for InfluxDB 2's Single-AZ volumes, so long retention is cheaper there.
Measure what is read before you cut anything
Three reads tell you which lever applies. First, the bill by usage type, with get-cost-and-usage grouped by service and usage type: QueryTCU, MemoryStore-ByteHrs, MagneticStore-ByteHrs and DataIngestion-Bytes in the price list, prefixed by Region.
aws ce get-cost-and-usage --time-period Start=2026-10-01,End=2026-11-01 \
  --group-by Type=DIMENSION,Key=SERVICE Type=DIMENSION,Key=USAGE_TYPE \
  --granularity MONTHLY --metrics UnblendedCost \
  --query "ResultsByTime[].Groups[?contains(Keys[0], 'Timestream')]"
Second, the shape of query compute. Timestream publishes TCUs used per minute as ResourceCount with the dimensions Service=Timestream, Resource=QueryTCU, Type=Resource, Class=OnDemand, in the AWS/Usage namespace. A flat line at 4 through nights and weekends is a screen nobody watches.
aws cloudwatch get-metric-statistics --namespace AWS/Usage --metric-name ResourceCount \
  --dimensions Name=Service,Value=Timestream Name=Resource,Value=QueryTCU \
    Name=Type,Value=Resource Name=Class,Value=OnDemand \
  --start-time 2026-10-24T00:00:00Z --end-time 2026-11-01T00:00:00Z \
  --period 3600 --statistics Maximum
Third, who queries which table. Timestream logs Query API calls to CloudTrail on the resource types AWS::Timestream::Database and AWS::Timestream::Table, which CloudTrail lists as data events, at $0.10 per 100,000 events in CloudTrail's price list. A month of them, grouped by caller and table, shows which tables have a reader and which only have a writer. Writes are not logged, so the write side comes from your gateway configuration.
The objection: operators need live screens
The strongest case against this: a line stoppage costs more in an hour than this whole bill in a year, and an operator watching a screen is the point of collecting the data.
That holds for the screens operators actually watch, and those should stay fast. The waste is the refresh nobody sees: the office dashboard left open overnight, the panel for a line that was moved, the alert query that runs every 10 seconds on a value that changes hourly. The TCU graph and the CloudTrail log show which is which before anything changes. Alarms that need second-level response may belong on the gateway, not in a database query.
What this model does not tell you
- List prices, read November 1, 2026, US East. Other Regions, private pricing and Database Savings Plans, which the pricing page lists as the other Timestream option, change the numbers. Provisioned TCUs, offered in select Regions (not in the US East price list), bill by the hour with a 1-hour minimum and change the always-on case.
- The plant is hypothetical, and so are the record layout, the 222-byte record and the use of the same size for storage, which AWS's own examples assume.
- TCU use is modelled, not measured. AWS says TCUs depend on query shape, partitions scanned and concurrency. Heavier queries need more than 4. AWS documents a 4-TCU minimum capacity; that each short query bills those 4 TCUs for the full 30 seconds is the re:Post answer's reading, which the TCU graph above confirms or refutes on your account.
- Older accounts may still be on the bytes-scanned query model, which the price list carries at $0.01 per GB scanned. Moving to TCUs is a one-time opt-in, and it "is an irreversible change."
- Not priced: scheduled queries, AWS IoT Core or SiteWise in front of Timestream, data transfer, and any historian on site.
Plant data is paid for in more places than one database: how Industry 4.0 multiplies plant data and its cost and what PI AF alone does not tell you cover two. Across the whole platform, data and compute that nobody uses add up the same way.
Where Datapace fits
The Timestream bill splits query compute by usage type, not by screen, so it cannot show which dashboards still have a viewer. Datapace is building one map of your data estate (databases, warehouses, pipelines and what consumes them) with usage and cost attached, and agents that propose changes as pull requests your team reviews and merges. Tags also copied to a lake or a warehouse are paid for a second time, as what a data pipeline costs shows.
Sources
- AWS, Amazon Timestream pricing. AWS Price List API, US East, read November 1, 2026: Amazon Timestream; AWS CloudTrail.
- Amazon Timestream Developer Guide, Cost optimization, LiveAnalytics availability change, Writes metering, Writes, Query compute units, Metrics and dimensions and Logging with CloudTrail.
- Amazon Timestream API Reference, WriteRecords and RetentionProperties.
- Amazon CloudWatch User Guide, AWS usage metrics. AWS CloudTrail User Guide, Logging data events. AWS CLI Reference, timestream-write update-table and ce get-cost-and-usage.
- AWS re:Post, Timestream pricing per query.