TL;DR. Looker pricing has three parts, and Google publishes a number for only one. Platform editions and seats are quoted by sales. The AI token allowance has public rates, and its sizing changed twice in 2026: a hypothetical 200-user Enterprise instance went from 270M included input tokens a month to 300M, then 200M. The third part never shows on a Looker invoice: the warehouse queries dashboards send, including scheduled dashboards nobody opens, which Looker's Unused content folder may not list.
Below: the published prices, the token allowance that bills from February 2027, and a four-step audit with System Activity and BigQuery job labels. It is a worked model; no Looker instance was measured.
Looker pricing in 2026: one public rate, the rest by quote
Google's Looker pricing page, read November 7, 2026, splits Looker into platform pricing, "the cost to run a Looker (Google Cloud core) instance", and user pricing, which varies "based on the type of user and their permissions".
| What you pay for | Public price or quote | What Google states |
|---|---|---|
| Standard edition platform | Quote | For teams "with fewer than 50 users", up to 1,000 query-based API calls a month |
| Enterprise edition platform | Quote | Up to 100,000 query-based API calls a month |
| Embed edition platform | Quote | Up to 500,000 query-based API calls a month |
| Developer user | Quote | LookML Development Mode, administration, API, support |
| Standard user | Quote | Adds Explore, SQL Runner and dashboard creation |
| Viewer user | Quote | Dashboards, filters, drills, downloads and scheduling |
| Conversational Analytics tokens | Public | $3.00 per 1M input, $20.00 per 1M output, above the pool |
Every edition shows "Annual commitment, Call sales", in one, two or three-year terms, and "each platform comes with ten standard users and two developer users included". Use beyond the subscription can be invoiced "in arrears".
Looker's real cost includes the warehouse. When a dashboard, Look or Explore runs a query and finds no unexpired cached result, "Looker will run the query against the database", per Google's caching guide. That query bills in your warehouse, not on the Looker invoice.
Looker is not Looker Studio: cloud.google.com/looker-studio now redirects to the Data Studio page, which lists Data Studio at "No charge" and Pro at "$9 per user per project per month". For a BI tool with public seat prices, see Tableau pricing.
Looker's AI token allowance changed shape twice in 2026
Conversational Analytics covers chat in Explores and dashboards, data agents and the API. Its $3.00 and $20.00 rates held in every version we read; the included tokens and the billing date moved, per Internet Archive captures of May 16 (the rule already on January 18), August 24 and October 1.
| Pricing page | How included tokens are sized | Billing starts | Hypothetical 200-user Enterprise, included (input / output) |
|---|---|---|---|
| January to May 2026 | Per user, by type: Viewer 1M / 20K, Standard 2M / 40K, Developer 4M / 80K | October 1, 2026 | 270M / 5.4M (sum of per-user quotas) |
| August 2026 | Per edition, one shared instance pool: Standard 60M / 1.2M, Enterprise 300M / 6M, Embed 1.2B / 24M | October 1, 2026 | 300M / 6M |
| October 1, 2026 | Per edition, unchanged | Postponed, with "at least 90 days advance notice" | 300M / 6M |
| November 7, 2026 (live) | Shared pool: 1M / 20K per internal user, 250K / 5K per embed user, production minimum 60M / 1.2M | February 1, 2027 | 200M / 4M |
The hypothetical instance has 10 Developers, 40 Standard users and 150 Viewers.
The same instance lost a third of its included input tokens between October and November. A team that used the full per-edition pool every month would pay, from February 2027, for 100M input and 2M output tokens above it: 100 x $3.00 + 2 x $20.00 = $340 a month, $4,080 a year. The promotion runs "through January 31, 2027"; Google points to "Looker's System Activity dashboards" to baseline usage before then.
Why the Looker bill grows without anyone deciding
- Roles set the user type. User cost varies by "the type of user and their permissions", and a service account with Viewer and Developer roles "uses a Developer license", per the user management guide. Check each user's highest role, not the one they need.
- Leavers stay on the Users page. After access is revoked in IAM or the identity provider, "the user account will still appear active on the Users page" until someone deletes it in Looker. The guide does not say whether such accounts still count against licenses; the token pool counts "enabled users".
- Viewers can schedule. The Viewer type includes "Scheduling", so the most limited seat can start a recurring warehouse query.
Step 1: list dashboards nobody opened in 90 days, then the ones Looker hides
Looker's Unused content folder (Looker 26.14 or later) lists dashboards and Looks with few direct views in a chosen window, "90 days is selected by default", and lets an admin schedule them for the trash. It leaves out public content, favorites and content used by API sources such as Connected Sheets.
The folder may skip the costly case. Content counts as unused "if it meets one of the following criteria": 0 views in the window, "no active schedules configured for the piece of content", or no temporary exclusion by the owner. Read literally, a scheduled dashboard with 0 views qualifies; but the third criterion only works combined with the others, and Google does not say which reading applies.
Check whether one scheduled dashboard you know nobody opens shows up in the folder, and do not rely on the folder for scheduled content. To find those:
- Open the Content Usage Explore in System Activity and select Content Title, View Total, Schedule Total and Days Since Last Accessed.
- Keep rows with Schedule Total above 0 and a low View Total over your window.
- Before filtering on Days Since Last Accessed, check whether a scheduled run updates it; the System Activity Explores guide does not say.
Action: send the list to each owner, then pause the schedule.
Step 2: find users with no query in 90 days, and Standard users who only view
In the User Explore, filter Most Recent Query Date to before 90 days ago or null (History keeps 90 days) and add the role: these seats need review before renewal. A history record exists "only when a database query successfully executes", so cross-check logins in the Event Explore.
To spot Standard users who only read dashboards, the same guide gives filters to "isolate true Explorer UI activity": in History, Source is explore, Dashboard ID and Look ID are null, Query Link contains /explore/ or /x/, and Issuer Source is ui. A Standard user with no such rows, no sqlrunner queries and no content created in 90 days is a candidate for a Viewer seat.
Action: delete removed users in Looker, not only in IAM. On an instance linked to Data Studio Pro, deleting users "reduces the number of complimentary Data Studio Pro licenses", and any shortfall becomes paid Pro seats at once.
Step 3: find schedules nobody reads before Looker forgets them
The Scheduled Plan Explore lists each schedule's owner, Cron Schedule and destination; filter Run Once to No and join it to Step 1's dashboards.
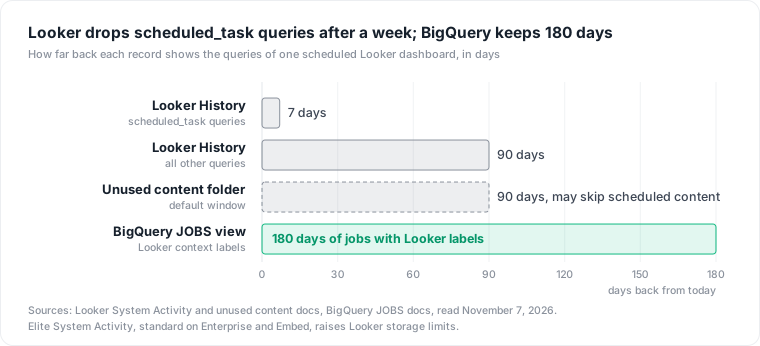
Queries logged as scheduled_task leave Looker's history after a week. System Activity deletes History rows older than 90 days, and those "more than 7 days in the past" whose source is scheduled_task. Scheduled CSV deliveries are logged under other sources (data-download-api for dashboards, explore for Looks) and keep the 90 days. The same field list says a dashboard query "may have been initiated ... from a scheduled task", so check which source your schedules are logged under before you rely on History. Elite System Activity, standard on Enterprise and Embed, "increases System Activity performance and storage limits", per the System Activity guide; Google does not say whether it changes these rules.
Two settings multiply a schedule's queries. Run schedule as recipient, for email deliveries, sends to each recipient "as if each one of them had run the query". On a BigQuery connection with per-user OAuth, Looker reuses cached results "only if the same user has run the same query".
Step 4: price the warehouse queries with Looker's BigQuery job labels
On BigQuery, Looker labels its jobs by default. Its BigQuery connection guide lists the default label keys looker-context-user_id, looker-context-history_slug and looker-context-instance_slug; a later paragraph and its example call the second one looker-context-history_id, so match both. BigQuery's INFORMATION_SCHEMA.JOBS keeps "job history for the past 180 days" with those labels and total_bytes_billed.
-- Bytes billed by Looker jobs in the last 7 days, per Looker query history ID
SELECT
  (SELECT ANY_VALUE(value) FROM UNNEST(j.labels)
   WHERE key IN ('looker-context-history_slug',
                 'looker-context-history_id'))  AS looker_history_id,
  (SELECT value FROM UNNEST(j.labels)
   WHERE key = 'looker-context-user_id')     AS looker_user_id,
  COUNT(*)                                   AS jobs,
  SUM(j.total_bytes_billed) / POW(2, 40)     AS tib,
  SUM(j.total_bytes_billed) / POW(2, 40) * 6.25 AS usd_on_demand
FROM `region-us`.INFORMATION_SCHEMA.JOBS AS j
WHERE j.creation_time >= TIMESTAMP_ADD(CURRENT_TIMESTAMP(), INTERVAL -7 DAY)
  AND j.job_type = 'QUERY'
  AND j.statement_type != 'SCRIPT'
  AND EXISTS (SELECT 1 FROM UNNEST(j.labels) WHERE key LIKE 'looker-context-%')
GROUP BY looker_history_id, looker_user_id
ORDER BY tib DESC;
Join looker_history_id to History ID while the scheduled rows still exist (check the values match on your instance) and scale a week by the schedule's cron. The view covers the current project only. $6.25 is the on-demand rate per TiB in the US multi-region on the BigQuery pricing page; some single US regions cost more, and the first TiB a month is free. On editions projects, total_bytes_billed is informational only, because bytes are not billed; sum total_slot_ms instead (see BigQuery on-demand vs editions). The column is empty for queries on tables with row-level access policies.
On other databases, Looker adds a SQL context comment such as -- Looker Query Context '{"user_id":1,"history_id":4757,...}'. On BigQuery it is off by default because comments "invalidate BigQuery's ability to cache".
One unread dashboard: $402.83 a month in BigQuery
Consider a 12-tile dashboard delivered 10 times each weekday: 220 times in a 22-weekday month. Each tile scans 25 GiB of an unpartitioned fact table that loads hourly, so BigQuery does not reuse cached results ("If any of the referenced tables or logical views have changed"), and when Looker's cached results "have expired, Looker will rerun the query"; its default cache retention "is one hour".
| Line | Arithmetic | Result |
|---|---|---|
| Bytes per delivery | 12 tiles x 25 GiB | 300 GiB |
| Bytes per month | 300 GiB x 220 deliveries | 66,000 GiB = 64.453 TiB |
| BigQuery on-demand | 64.453 TiB x $6.25 | $402.83 a month, $4,833.98 a year |
The free TiB is left out, assuming other queries use it. Hold the result next to your contract's seat price. Run as three recipients with different access filters, the same schedule can send up to three times the queries.
Removing idle seats shrinks the token pool by $3.40 a user at most
Each enabled internal user adds 1M input and 20K output tokens to the pool. Deleting 45 idle users from the 200-user instance removes 45M and 900K: 45 x $3.00 + 0.9 x $20.00 = $153 a month at overage rates, $3.40 a user, and only if the pool is fully used. Run the seat audit 90 days before renewal, since every edition is an annual commitment, and pause unread schedules today: the warehouse stops billing at the next run.
Limits: seats are quoted, so this post cannot price one. The token rules may change again before February. The dashboard is hypothetical; capacity pricing and BI Engine change its arithmetic. For where BI sits in the whole bill, see data warehouse cost.
The link between a dashboard, its readers and its queries sits in two systems with different windows. Datapace is building one map of your data estate (databases, warehouses, pipelines and what consumes them) with usage and cost attached, and agents that propose changes as pull requests your team reviews and merges. If BI tools are a large share of your bill, book a call and walk us through one.
Sources
- Google Cloud, Looker pricing, read November 7, 2026; Internet Archive captures of May 16, 2026, August 24, 2026 and October 1, 2026.
- Google Cloud, Data Studio (pricing section).
- Looker docs, Manage users within Looker (Google Cloud core) and Managing unused content.
- Looker docs, System Activity pages and Creating usage reports with System Activity Explores.
- Looker docs, Scheduling and sending dashboards, Caching queries and Google BigQuery connection.
- BigQuery docs, INFORMATION_SCHEMA.JOBS, Using cached query results and BigQuery pricing.