
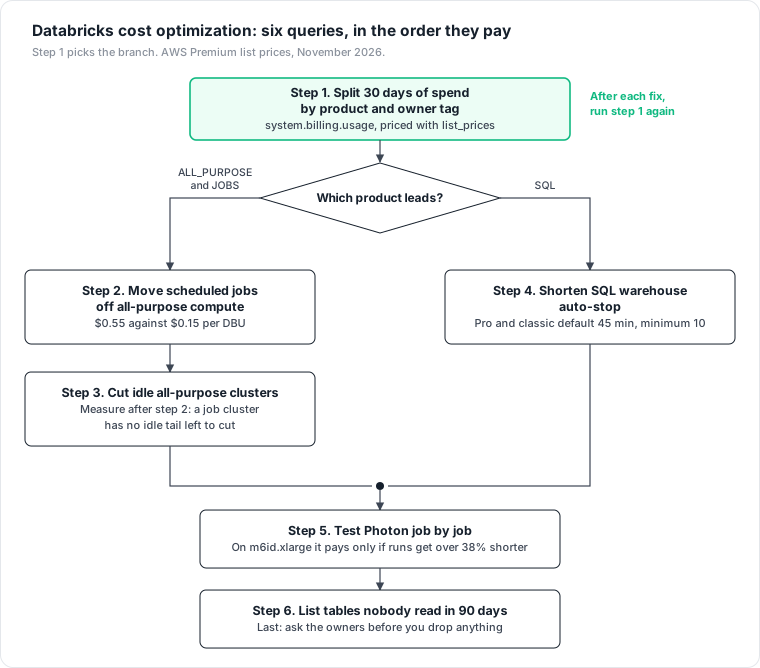
TL;DR. Databricks cost optimization works best as a sequence: one query that splits the bill by product and owner, then the lever that query points to, then the next query run again on the smaller bill. The levers overlap. In a worked example, moving one cluster's nightly jobs to Jobs Compute saves about $682 a month and also deletes the idle tail that a shorter auto-termination would have cut, so sizing the two separately promises about $1,007 from a cluster that can give $682.
Run these six Databricks cost optimization queries in order on your own workspace: attribution first, then the two rate and idle fixes that need no code change, then Photon, which needs a test, and storage last, because dropped data is the change that is hardest to take back. Each step gives the query, the result that means act, and the change to make. For what a DBU costs and how the bill splits between Databricks and your cloud provider, see Databricks DBU cost.
All queries read Databricks system tables and price usage at list price through system.billing.list_prices. Prices are AWS Premium list rates from Databricks' rate data, read November 4, 2026. The worked examples are hypothetical workspaces, not measurements, and none of the six queries has been tested on a live account here. Each one is written against the schemas as Databricks documented them on November 4, 2026.
Step 1: split 30 days of spend by product and owner tag
-- Step 1: list cost by product, and how much of it carries an owner tag
SELECT
  u.billing_origin_product,
  map_contains_key(u.custom_tags, 'team') AS has_team_tag,  -- your tag key
  ROUND(SUM(u.usage_quantity * p.pricing.effective_list.default), 2) AS list_cost,
  ROUND(100 * SUM(u.usage_quantity * p.pricing.effective_list.default)
    / SUM(SUM(u.usage_quantity * p.pricing.effective_list.default)) OVER (), 1) AS pct
FROM system.billing.usage u
JOIN system.billing.list_prices p
  ON  p.sku_name = u.sku_name
  AND p.cloud = u.cloud
  AND u.usage_end_time >= p.price_start_time
  AND (p.price_end_time IS NULL OR u.usage_end_time < p.price_end_time)
WHERE u.usage_date >= current_date() - INTERVAL 30 DAYS
GROUP BY ALL
ORDER BY list_cost DESC;
Act on the top row, not on a generic checklist. billing_origin_product names the product behind each record: JOBS, ALL_PURPOSE for classic all-purpose compute, SQL for SQL warehouses, INTERACTIVE for serverless interactive workloads, and others. If ALL_PURPOSE and JOBS lead, go to step 2. If SQL leads, go to step 4 first.
Untagged rows are spend with no owner to ask. On classic compute, a compute policy can set tag values with custom_tags.<mytag>. On serverless, serverless usage policies, in Public Preview, apply tags that "are logged in your billing records", and usage_metadata.usage_policy_id shows which policy a record carried. Databricks also announced serverless compute tags in Beta on October 29, 2026.
Step 2: find scheduled jobs running on all-purpose compute
WITH ap_clusters AS (
  SELECT workspace_id, cluster_id, cluster_name, owned_by, auto_termination_minutes
  FROM system.compute.clusters
  WHERE cluster_source IN ('UI', 'API')
  QUALIFY ROW_NUMBER() OVER (
    PARTITION BY workspace_id, cluster_id ORDER BY change_time DESC) = 1
),
job_clusters AS (
  SELECT workspace_id, job_id, EXPLODE(compute_ids) AS cluster_id
  FROM system.lakeflow.job_task_run_timeline
  WHERE period_start_time >= current_date() - INTERVAL 30 DAYS
  GROUP BY ALL
),
cluster_cost AS (
  SELECT u.workspace_id, u.usage_metadata.cluster_id AS cluster_id,
         SUM(u.usage_quantity * p.pricing.effective_list.default) AS dbu_list_cost
  FROM system.billing.usage u
  JOIN system.billing.list_prices p
    ON  p.sku_name = u.sku_name
    AND p.cloud = u.cloud
    AND u.usage_end_time >= p.price_start_time
    AND (p.price_end_time IS NULL OR u.usage_end_time < p.price_end_time)
  WHERE u.billing_origin_product = 'ALL_PURPOSE'
    AND u.usage_date >= current_date() - INTERVAL 30 DAYS
  GROUP BY ALL
)
SELECT c.cluster_name, c.owned_by, c.auto_termination_minutes,
       COUNT(DISTINCT j.job_id) AS jobs_on_cluster,
       ROUND(MAX(k.dbu_list_cost), 2) AS cluster_dbu_list_cost
FROM job_clusters j
JOIN ap_clusters c USING (workspace_id, cluster_id)
LEFT JOIN cluster_cost k USING (workspace_id, cluster_id)
GROUP BY ALL
ORDER BY cluster_dbu_list_cost DESC;
The first two CTEs follow Databricks' own query for jobs on all-purpose compute: cluster_source values UI and API "only apply to all-purpose compute". The cost column is the whole cluster, notebooks included, because Databricks says a job's cost on shared all-purpose compute "is not possible with 100% accuracy".
Every row is a job paying the all-purpose rate. On an m6id.xlarge, the node burns 0.76 DBU an hour on either compute type, which costs $0.418 on All-Purpose and $0.114 on Jobs Compute in the Premium tier. Point the job at a new job cluster with the same node type. A job cluster also ends with the job: Databricks notes that new job compute "terminates and is unavailable for restarting when the job is complete".
A worked month: one shared cluster, two levers, one saving
Consider a hypothetical cluster of one driver and eight workers, all m6id.xlarge, that runs nightly jobs for 4 hours, with auto-termination at 120 minutes, for 30 nights. A node-hour costs $0.6553 on All-Purpose and $0.3513 on Jobs Compute, each including $0.2373 for the instance at its EC2 on-demand price in US East.
| Setup | Node-hours a month | Monthly cost |
|---|---|---|
| Today: All-Purpose, 4 h busy plus 2 h idle | 9 × 6 × 30 = 1,620 | $1,061.59 |
| Step 3 alone: auto-termination cut to 10 minutes | 9 × (4 + 10/60) × 30 = 1,125 | $737.21 |
| Step 2: Jobs Compute, terminates at job end (start-up minutes ignored) | 9 × 4 × 30 = 1,080 | $379.40 |
Step 2 saves about $682 and leaves step 3 nothing on this cluster. Sized separately, step 3 promises about $324 more, for a total of about $1,007. That money does not exist: the job cluster already stopped billing the idle tail. Run step 3 after step 2, on the clusters still standing.
Step 3: find all-purpose clusters that bill while idle
WITH ap_clusters AS (
  SELECT workspace_id, cluster_id, cluster_name, owned_by, auto_termination_minutes
  FROM system.compute.clusters
  WHERE cluster_source IN ('UI', 'API')
  QUALIFY ROW_NUMBER() OVER (
    PARTITION BY workspace_id, cluster_id ORDER BY change_time DESC) = 1
),
nt AS (
  SELECT workspace_id, cluster_id, driver,
         date_trunc('MINUTE', start_time) AS minute,
         cpu_user_percent + cpu_system_percent AS cpu
  FROM system.compute.node_timeline
  WHERE start_time >= current_date() - INTERVAL 30 DAYS
),
quiet AS (  -- minutes where the driver is near zero CPU; 5% is our threshold
  SELECT workspace_id, cluster_id, minute FROM nt WHERE driver AND cpu < 5
)
SELECT c.cluster_name, c.owned_by, c.auto_termination_minutes,
       ROUND(COUNT(*) / 60.0, 1) AS node_hours,
       ROUND(COUNT(q.minute) / 60.0, 1) AS quiet_node_hours
FROM nt
JOIN ap_clusters c USING (workspace_id, cluster_id)
LEFT JOIN quiet q USING (workspace_id, cluster_id, minute)
GROUP BY ALL
ORDER BY quiet_node_hours DESC;
node_timeline holds one record "for a given minute of time per instance", so a count of rows divided by 60 is node-hours. Multiply quiet_node_hours by your node-hour price to get the monthly prize: $0.6553 per hour of an m6id.xlarge on All-Purpose. A row with auto_termination_minutes at 0 never auto-terminates, since an owner can turn the timer off "by specifying an inactivity period of 0".
The change: a compute policy that fixes autotermination_minutes, the setting where "a value of 0 represents no auto termination". Databricks' best-practices page asks for "a reasonable value (for example, 1 hour)"; the allowed range is 10 to 10,000 minutes. The driver CPU threshold is a heuristic, so check the top clusters by hand: a driver waiting on a slow external call looks quiet too.
Step 4: find SQL warehouses billed while no query runs
WITH wh AS (
  SELECT workspace_id, warehouse_id, warehouse_name, warehouse_type,
         warehouse_size, auto_stop_minutes
  FROM system.compute.warehouses
  QUALIFY ROW_NUMBER() OVER (
    PARTITION BY workspace_id, warehouse_id ORDER BY change_time DESC) = 1
),
billed AS (
  SELECT u.workspace_id, u.usage_metadata.warehouse_id AS warehouse_id,
         SUM(u.usage_quantity) AS dbus,
         SUM(u.usage_quantity * p.pricing.effective_list.default) AS dbu_list_cost
  FROM system.billing.usage u
  JOIN system.billing.list_prices p
    ON  p.sku_name = u.sku_name
    AND p.cloud = u.cloud
    AND u.usage_end_time >= p.price_start_time
    AND (p.price_end_time IS NULL OR u.usage_end_time < p.price_end_time)
  WHERE u.usage_metadata.warehouse_id IS NOT NULL
    AND u.usage_date >= current_date() - INTERVAL 30 DAYS
  GROUP BY ALL
),
busy AS (
  SELECT workspace_id, compute.warehouse_id AS warehouse_id,
         COUNT(DISTINCT m) AS busy_minutes
  FROM system.query.history
  LATERAL VIEW EXPLODE(sequence(date_trunc('MINUTE', start_time),
                                date_trunc('MINUTE', end_time),
                                INTERVAL 1 MINUTE)) AS m
  WHERE compute.type = 'WAREHOUSE'
    AND start_time >= current_date() - INTERVAL 30 DAYS
  GROUP BY ALL
)
SELECT wh.warehouse_name, wh.warehouse_type, wh.warehouse_size,
       wh.auto_stop_minutes,
       ROUND(b.dbus / CASE wh.warehouse_size
         WHEN '2X_SMALL' THEN 4 WHEN 'X_SMALL' THEN 6 WHEN 'SMALL' THEN 12
         WHEN 'MEDIUM' THEN 24 WHEN 'LARGE' THEN 40 WHEN 'X_LARGE' THEN 80
         WHEN '2X_LARGE' THEN 144 WHEN '3X_LARGE' THEN 272
         WHEN '4X_LARGE' THEN 528 WHEN '5X_LARGE' THEN 1042 END, 1) AS billed_cluster_hours,
       ROUND(bz.busy_minutes / 60.0, 1) AS busy_hours,
       ROUND(b.dbu_list_cost, 2) AS dbu_list_cost
FROM wh
JOIN billed b USING (workspace_id, warehouse_id)
LEFT JOIN busy bz USING (workspace_id, warehouse_id)
ORDER BY dbu_list_cost DESC;
The DBUs per hour by size come from Databricks' rate data (Small 12, Medium 24, Large 40, up to 1,042 for 5X-Large). The query divides DBUs by that per-cluster rate, so on a warehouse that scaled out it returns cluster-hours, which can exceed wall-clock hours; compare the two columns on single-cluster warehouses first.
A large gap between billed and busy hours on a Pro or classic warehouse often points to the auto-stop setting. Databricks sets it to "45 minutes" for Pro and classic warehouses, a value it calls recommended for typical use, with a minimum of 10, and to 10 minutes for serverless, which the API can lower to 1. Idle warehouses "continue to accumulate DBU and cloud instance charges until they are stopped".
Consider a hypothetical BI workspace with a Pro Medium warehouse, 24 DBU an hour at $0.55, so $13.20 an hour of DBUs. Analysts send 12 separate bursts of queries a day, each 5 minutes long and more than 45 minutes apart, on 22 working days. At the 45-minute default, each burst bills 50 minutes: 220 hours and $2,904.00 of DBUs a month, for 22 busy hours. At 10 minutes, each burst bills 15 minutes: 66 hours and $871.20. The change saves $2,032.80 of DBUs a month, plus the cloud instance charges for the same 154 hours.
The cost of the change is cold starts. A Pro warehouse that stops more often starts more often, and analysts wait. Measure your start time from the STARTING and RUNNING events in system.compute.warehouse_events before you pick the value.
Step 5: test Photon job by job against the full node-hour
SELECT u.usage_metadata.job_id AS job_id,
       u.product_features.is_photon AS is_photon,
       COUNT(DISTINCT u.usage_metadata.job_run_id) AS runs,
       ROUND(SUM(u.usage_quantity * p.pricing.effective_list.default)
         / COUNT(DISTINCT u.usage_metadata.job_run_id), 2) AS dbu_cost_per_run
FROM system.billing.usage u
JOIN system.billing.list_prices p
  ON  p.sku_name = u.sku_name
  AND p.cloud = u.cloud
  AND u.usage_end_time >= p.price_start_time
  AND (p.price_end_time IS NULL OR u.usage_end_time < p.price_end_time)
WHERE u.billing_origin_product = 'JOBS'
  AND u.usage_date >= current_date() - INTERVAL 60 DAYS
GROUP BY ALL
ORDER BY job_id, is_photon;
A job with both a true and a false row is a Photon test you already ran. This query prices DBUs only. On classic compute, add the instance half before deciding: on an m6id.xlarge Jobs Compute node, Photon raises the node-hour from $0.3513 to $0.5679, so it pays only if the run gets more than 38% shorter. Databricks DBU cost has the node-hour table and a query for the EC2 half.
Step 6: find tables nobody has read in 90 days
WITH reads AS (
  SELECT DISTINCT source_table_full_name AS t, source_path AS path
  FROM system.access.table_lineage
  WHERE (source_table_full_name IS NOT NULL OR source_path IS NOT NULL)
    AND event_time >= current_date() - INTERVAL 90 DAYS
),
writes AS (
  SELECT target_table_full_name AS t, MAX(event_time) AS last_write
  FROM system.access.table_lineage
  WHERE target_table_full_name IS NOT NULL
    AND event_time >= current_date() - INTERVAL 90 DAYS
  GROUP BY ALL
)
SELECT concat_ws('.', i.table_catalog, i.table_schema, i.table_name) AS t,
       i.table_type, i.created, w.last_write
FROM system.information_schema.tables i
LEFT ANTI JOIN reads r1
  ON r1.t = concat_ws('.', i.table_catalog, i.table_schema, i.table_name)
LEFT ANTI JOIN reads r2
  ON r2.path = i.storage_path
LEFT JOIN writes w
  ON w.t = concat_ws('.', i.table_catalog, i.table_schema, i.table_name)
WHERE i.table_type IN ('MANAGED', 'EXTERNAL')
  AND i.created < current_date() - INTERVAL 90 DAYS
ORDER BY w.last_write DESC NULLS LAST;
In system.access.table_lineage, a row with a source and no target is a pure read, and a row with both is a read that feeds a write; this query counts both as reads. A read by path carries source_path, "the path if it's reading from cloud storage directly", which is why the second anti join matches it against the table's storage_path. That match is an exact string, so a read of a subfolder still leaves the table on the list, and writes by path (target_path) are not counted in last_write. The rows at the top, still written in the last 90 days but never read, cost twice: the compute that writes them and the storage that keeps them.
Treat the list as candidates, not a delete list. Databricks warns that lineage tables "represent a subset of all read/write events, as it is not always possible to capture lineage", and they keep only a rolling 1-year window. Ask each owner from step 1 before you drop or archive anything. The storage cost of tables on Databricks default storage shows up in step 1 under DEFAULT_STORAGE; for tables in your own S3 bucket, S3 storage cost prices what a Delta table keeps.
Order for BI-heavy vs pipeline-heavy workspaces
| Pipeline-heavy | BI-heavy | |
|---|---|---|
| Step 1 shows most spend in | ALL_PURPOSE and JOBS | SQL |
| Run next | Step 2, then step 3 on the clusters left | Step 4 |
| Worked example above | About $682 a month from one shared cluster | $2,032.80 a month of DBUs from one warehouse |
| After the first fix | Run step 3: job clusters have no idle tail left to cut | Run step 1 again: the new top row is the next step |
| When the step is not worth it | A cluster whose monthly prize is smaller than the hour it takes to change it | A warehouse users need warm all day |
The strongest objection is that the hours cost more than the savings. On a small workspace that can be true, and step 1 tells you: if the top row is a few hundred dollars a month, stop there. Steps 2 and 3 are one-time policy changes; steps 5 and 6 need a test or an owner's answer, which is why they come last.
Idle compute and unread tables are not a Databricks problem alone; cloud waste in data infrastructure covers the same waste across the estate, and Snowflake cost optimization runs this measure-first method on a warehouse. Datapace is building one map of your data estate with usage and cost attached, and agents that propose changes as pull requests your team reviews and merges, such as a job moved off a shared cluster or a lower auto-stop. To see where Databricks sits in the whole bill first, read data warehouse cost.