
TL;DR. A data infrastructure intelligence platform keeps one unified model of an organization's data infrastructure, connecting dependencies, usage, cost and business context across providers and hosting models. Three characteristics define it: infrastructure-wide visibility, unified dependency, usage and cost intelligence, and business and operational context. Existing tools overlap with parts of this work, and the difference is the unified model. Cost is its first measurable application.
Organizations with more than 5,000 employees spend an average of $29.3M a year on data programs (Fivetran 2026). Fewer and fewer people can say what that estate holds, what it costs or what it is for, because each tool in the stack sees one part of it. A data infrastructure intelligence platform makes enterprise data infrastructure understandable and actionable, with cost as its first measurable application.
Definition. A data infrastructure intelligence platform creates and maintains a unified model of an organization's data infrastructure, connecting operational systems, databases, data platforms, pipelines and the applications that consume their data, whatever the provider and wherever they are hosted.
It combines infrastructure dependencies, usage, costs and business context to help organizations understand how their data estate operates, where resources are consumed, and what should change.
It turns that intelligence into actionable recommendations and controlled changes, while making the same infrastructure knowledge accessible to both enterprise teams and AI agents.
Engineers will call this an infrastructure model. Everyone else can call it the map. The rest of this article uses both for the same thing.
The category answers three questions about a data estate
Data infrastructure means everything that stores, moves and serves data: operational systems, databases, warehouses, pipelines, and whatever consumes them. In a large organization that estate has grown over decades, and it keeps growing. More databases, more cloud, more pipelines, and now AI on top.
Three questions get harder to answer as it grows.
What does it hold? Systems, dependencies and data flows, often in legacy environments that are poorly documented.
What does it cost? The bill is visible by vendor. What drives it across the chain is much harder to see.
What is it for? Which projects and business uses consume the data, and which processing is redundant.
The value is in the connections
Each answer is useful alone. The value appears when they sit on the same map: a cost tied to a dependency, a dependency tied to a business use, a business use tied to a decision.
Consider a manufacturer. An MES generates operational data. That data is replicated into SQL Server, a pipeline moves it into a data lake, Databricks processes it, and Power BI serves reports to several departments. AI workloads are starting to consume the same data.
A bill shows what the data platform costs. A unified model also shows:
- which operational systems generate the data
- which databases, pipelines and platforms process it
- which workloads and business applications consume it
- what each component costs
- which dependencies a change would affect
- where optimization or modernization is possible
Existing tools go deep, and each has a center of gravity
Data flows through four layers before anyone uses it. A cost seen in a dashboard or a warehouse usually starts further upstream, in an operational system or a pipeline that nobody connects to it. Existing tools are strong at what they were built for, and their scopes keep growing.
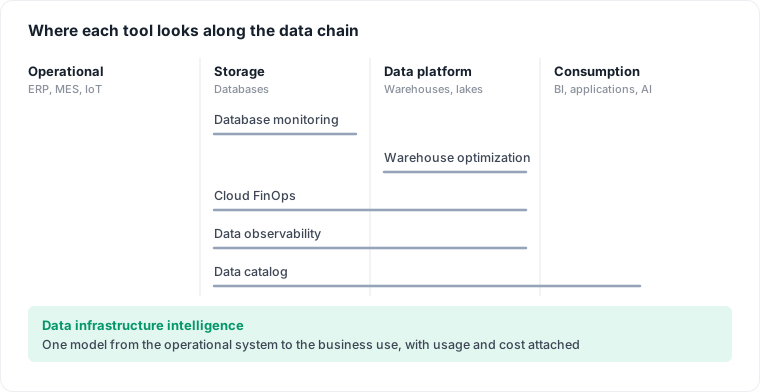
Typical center of gravity of each tool, simplified. Scopes overlap in practice.
| Category | Center of gravity | Also reaches into |
|---|---|---|
| Cloud FinOps | AWS, Azure and GCP spend | Allocation and workload-level cost attribution |
| Database monitoring | Performance and SQL queries | Query-level resource consumption |
| Data observability | Quality, reliability and pipelines | Cost-related capabilities in some products |
| Data catalog | Metadata and understanding of the data | Lineage and dependency mapping |
| Warehouse optimization | Snowflake, Databricks and similar costs | Analysis beyond simple warehouse billing |
These products overlap, and many already do part of this work. The difference is the model. Few keep one across the entire infrastructure that connects operational origins, technical dependencies, consumption, business purpose and financial impact, and that model is hard to build from inside a single layer. The specialist tools stay in place, and one operational and financial model connects what each of them sees.
The FinOps Foundation makes a related point about data cloud platforms: warehouse-level cost "shows a component of spend but rarely explains it." (FinOps Foundation)
Three characteristics define the category, two make it actionable
A product belongs in the category when it has these three.
- Infrastructure-wide visibility. It covers the chain from operational systems to consumption, across providers and technologies. It is provider-agnostic and hosting-agnostic: on premise, cloud and SaaS sit on the same model.
- Unified dependency, usage and cost intelligence. All three sit on the same model, so a cost seen at the end of the chain can be followed back to its technical and operational origin.
- Business and operational context. It shows which business uses and operational systems generate the cost, and why a component exists.
Two further capabilities decide how much the map changes. A platform can belong to the category without them, and they are where products will differ most.
- Action under human control. It goes from diagnosis to concrete changes the organization's own team reviews and approves.
- Access for agents. The same intelligence is available to the organization's own agents and copilots.
Data intelligence describes the data. This category describes the estate.
The closest established term is the data intelligence platform. BARC describes these platforms as tools that "enhance data catalogs with intelligent AI/ML-supported functions", with value drawn from active metadata (BARC). The market is broader than the catalog, and many products now cover lineage, governance, observability and metadata intelligence.
The distinction is the object being managed. Data intelligence manages the data assets. Data infrastructure intelligence manages the estate that holds and processes them.
| Data intelligence | Data infrastructure intelligence |
|---|---|
| What does the data mean? | What systems hold and process the data? |
| Where does the data come from? | How does it move across the infrastructure? |
| Who can access it? | Who and what depend on it? |
| What can we learn from it? | What does it cost and what should change? |
The two meet on lineage and dependencies. An organization can run both, and a good catalog is a useful input to the map.
AI raises the cost of not understanding the estate
AI doesn't eliminate the complexity of enterprise data infrastructure. It increases the cost of not understanding it.
Spend is the visible part. In the dbt Labs 2026 survey, 57% of respondents report higher warehouse and compute spend, while only 36% report higher team budgets (dbt Labs 2026). Flexera's respondents estimate 29% of their IaaS and PaaS spend is wasted, the first rise in five years, as AI workloads surge (Flexera 2026). That figure is self-reported and covers cloud overall, and the effect of AI on any given bill varies widely with workload and architecture.
The deeper effect is complexity, and it comes in three forms.
- More compute and data processing workloads.
- More consumption of existing operational and enterprise data.
- More pressure to modernize legacy infrastructure and make enterprise data accessible to AI.
The third matters most. Most large enterprises cannot simply put agents on top of their infrastructure. They first need to understand what exists, where the data lives, what depends on it, and what can safely be exposed.
Visibility is half the job
Many products stop at visibility. The category goes from discovery to a change someone approves, in four steps.
| Step | What it takes | What the team gets |
|---|---|---|
| Discover | Infrastructure discovery, dependency mapping | What actually exists, and how systems relate |
| Understand | Cost attribution, usage intelligence, business context | Where money goes, what is used, why it exists |
| Optimize | Optimization agents | Improvements identified and proposed |
| Execute | Pull requests the team reviews and merges | Recommendations become controlled changes |
The last step is where trust is decided. An AI agent making uncontrolled changes to enterprise infrastructure is a risk few platform teams will accept. A pull request is a format engineers already trust: the change is concrete, the team reviews it, and it lands only when someone on that team merges it.
The same model can then serve other agents over MCP, so each new agent does not have to rediscover the estate.
Cost is the first use, and the map serves many others
This category matters most in large organizations where operational systems, legacy databases and modern platforms meet, and cost is hardest to explain. Manufacturing, transport and logistics, financial services and insurance are typical. The people who feel the problem are CIOs, CTOs and CDOs on the budget side, and data architects, platform engineers, FinOps and infrastructure teams day to day.
Cost reduction comes first because it is measurable, easy to justify, and has a clear budget owner. Performance, migrations, modernization and AI on the data follow, on the same map. Once the map exists it also supports infrastructure budgeting, architecture decisions, and the impact of a technical change before anyone makes it. For the cost use case in practice, see Snowflake cost optimization and cloud waste in data infrastructure.
What this category does not settle
A map is only as good as its correlations. Connecting a dashboard cost to an upstream system across several vendors is hard, and the category holds up only where a product shows a depth of analysis that existing tools do not offer. Buyers should ask for that proof on their own estate:
- Does discovery reach operational databases, legacy systems, ERP and MES, beyond cloud services?
- Can a cost be traced reliably from a cloud service through a pipeline to its operational source and business application?
- Have customers validated and implemented the savings, or are they theoretical recommendations?
- Does the model become more valuable as it covers more systems, dependencies and workloads?
The category also does not replace specialist tools. Teams still need monitoring, observability and a catalog for what those do well. And the name is young: we did not find an analyst category under this term. We propose it because a unified model of the estate is a different object from what any single layer keeps.
Datapace is building a data infrastructure intelligence platform to make enterprise data infrastructure understandable and actionable, starting with what it costs: one map of the data estate with usage and cost attached, agents that propose changes as pull requests your team reviews and merges, and the same map served to your own agents and copilots over MCP. To discuss your estate, book a call. On AWS RDS or Aurora, you can start with the free self assessment.
Sources
- Fivetran, Enterprise Data Infrastructure Benchmark 2026. 500 senior leaders, Q4 2025. Total data budget, not infrastructure alone.
- FinOps Foundation, FinOps for data cloud platforms, 2026.
- BARC, Score Data Intelligence Platform 2024, market overview.
- dbt Labs, State of Analytics Engineering 2026. 363 responses.
- Flexera, 2026 State of the Cloud. Self-reported, 753 respondents, cloud overall.